

1Introduction
1.1Current State of Urban Logistics
Urban logistics is undergoing a profound transformation as cities grapple with increasing delivery volumes and mounting environmental pressures. Studies suggest that up to 33% of light goods flows in cities could potentially be delivered by cargo bikes, pointing to significant untapped potential for sustainable urban logistics1 2 3 4. However, while many companies have piloted cargo bikes in limited contexts - often as part of corporate sustainability initiatives or green marketing campaigns - few have committed to large-scale transitions in their operations.
This hesitancy to embrace broader change is understandable. Transitioning from conventional van-based delivery to cargo bikes requires significant operational restructuring, investment in new equipment, potential changes to hub locations, and retraining of personnel. Without concrete evidence demonstrating both environmental and commercial benefits, many operators remain reluctant to undertake such fundamental transformations of their business models.
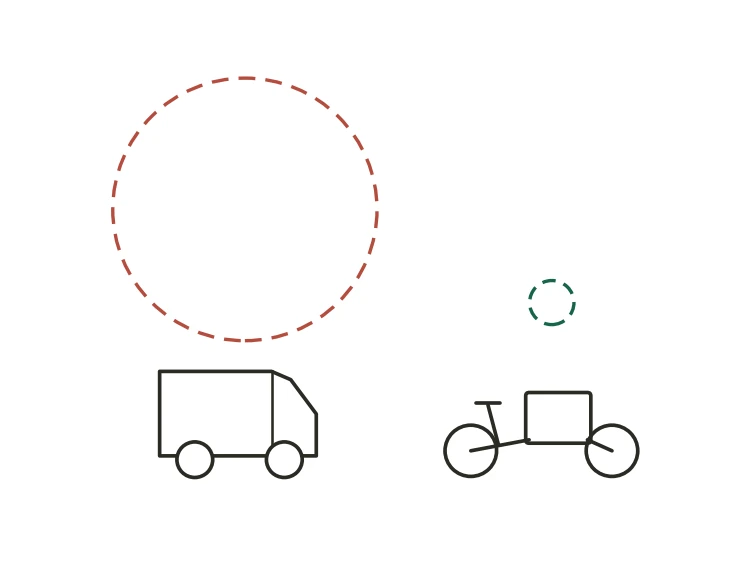
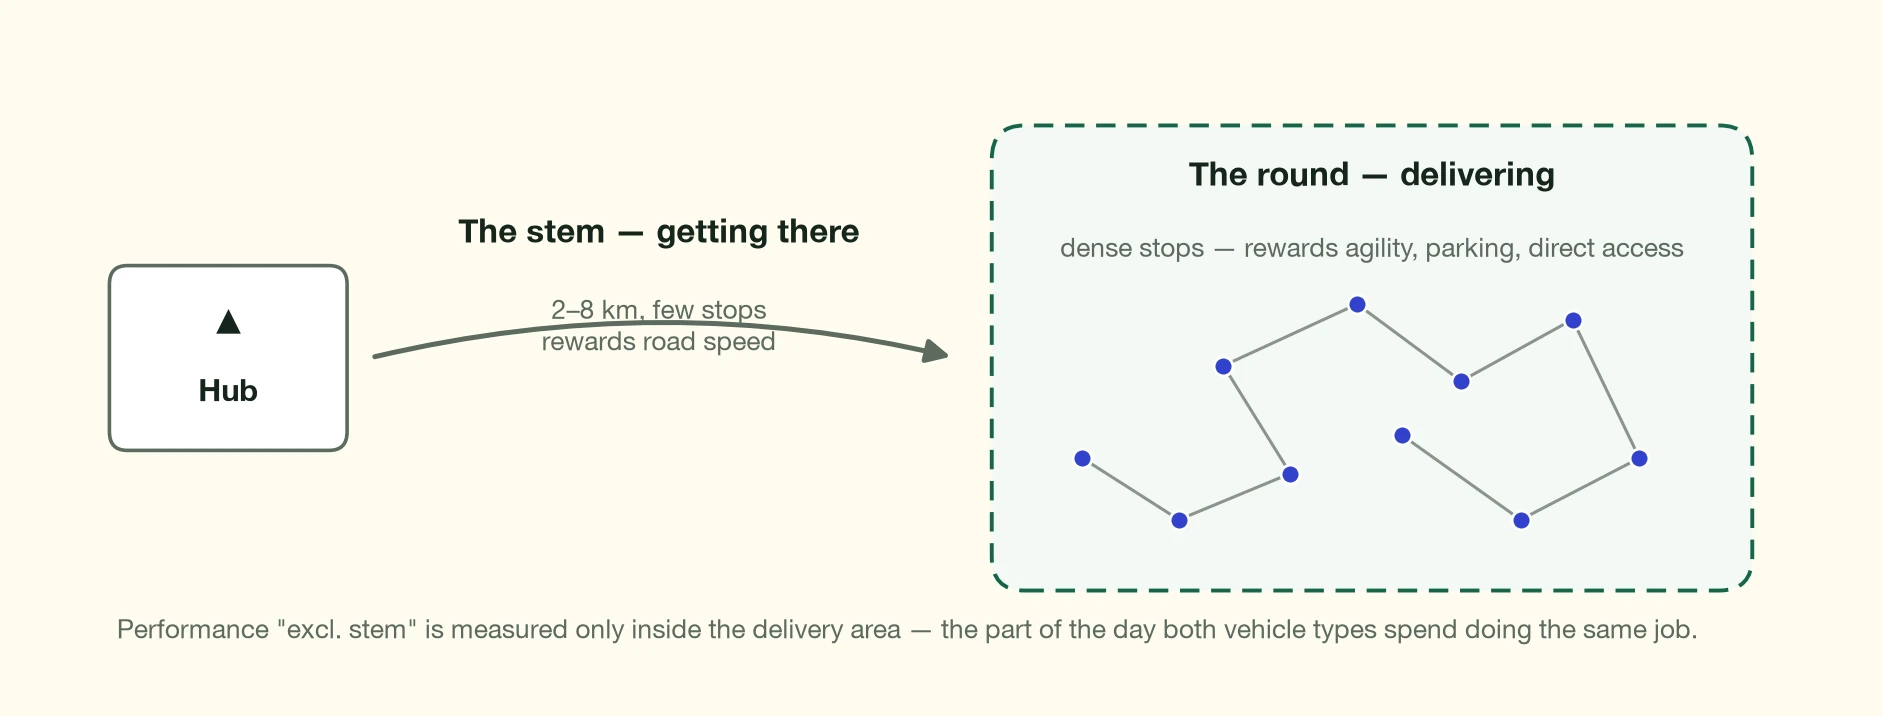
Previous research on urban delivery alternatives has often relied on simplified assumptions and theoretical models. Studies comparing cargo bikes and vans have typically used single statistics like average speed or parcels delivered per hour, failing to account for the complex interplay of factors affecting vehicle performance across different urban contexts. For instance, van performance is frequently misrepresented due to the inclusion of high-speed travel during the 'stem distance' from depot to city, which inflates average speed calculations.
The lack of standardisation in research methodologies has further complicated the assessment of different delivery options:
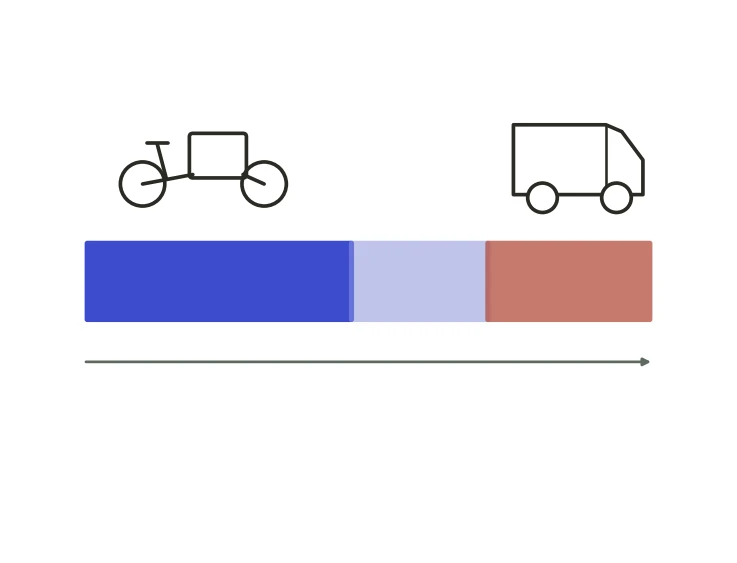
Some studies focus solely on vehicle speed, with widely varying assumptions - from 10 km/h for cargo bikes versus 30 km/h for vans in one study, while others have shown cargo bikes outperforming vans in dense areas.
Many studies fail to account for crucial factors like parking search time, which can add up to 25 minutes per stop for vans in congested areas5 6.
This variation in assumptions, attributed to the scarcity of reliable data, has created a significant gap in our understanding of urban logistics operations. A recent study7 by Kale AI analysing Urbike's operations in Brussels (2023) demonstrated the strong potential of cargo bikes in urban deliveries, finding they could park within 30 meters of delivery points and travel faster in congested conditions (16 kph vs 11 kph for vans).
However, like many previous studies, it had to rely on simulations and theoretical comparisons for van performance due to a lack of direct comparative data. Without robust real-world data comparing both vehicle types under similar conditions, companies struggle to make evidence-based decisions about fleet composition and delivery strategies.
1.2Aim of the Study
This study, designed in partnership with the Belgian Cycle Logistics Federation, aims to provide data-driven evidence to assess and demonstrate the potential of cycle-logistics for eCommerce operations, with the goal of accelerating the transition towards more sustainable urban delivery methods.
Our research approach encompassed multiple dimensions to build a comprehensive understanding of cycle logistics operations in Belgium. We conducted site visits to cycle logistics operators across multiple Belgian cities, engaging directly with operators to understand their experiences with Light Electric Vehicles (LEVs) and cargo bikes. These visits were complemented by the collection of performance data from multiple operators to build a robust picture of cycle logistics operations across different urban contexts.
While we gathered data from several operators, this report primarily focuses on analysing KGS Group's operations. This focus was chosen, as KGS provided a unique opportunity to directly compare van and cargo bike performance within the same organisation. As the only mixed-fleet carrier in our study, their experience offers particularly valuable insights into the practical challenges and benefits of operating both vehicle types. The richness of their operational data, particularly as it showcases their successful transition from traditional van operations to a mixed fleet, makes their study especially valuable for encouraging both policy makers and other logistics carriers to accelerate their shift towards modern delivery approaches.
Through this analysis, we aim to provide concrete, data-driven evidence of cycle logistics performance and identify the conditions under which cargo bikes can most effectively replace traditional van deliveries. This evidence is crucial for policy makers developing supportive frameworks for sustainable urban logistics, and for giving logistics operators the confidence to invest in cargo bike operations. By demonstrating both the environmental and commercial benefits of this transition, we hope to catalyse broader adoption of cycle logistics in urban areas.
1.3KGS Group Case Study Significance
Analysis of 32,547 deliveries across 345 routes: the first direct comparison of cargo bikes and vans serving identical flows for a single operator.
The study captures KGS Group's van-to-cargo-bike transition, giving real-world performance evidence across Brussels' diverse urban landscape.
In this context, our analysis of KGS Group's e-commerce delivery operations in Brussels represents a breakthrough in two critical dimensions.
First, it overcomes a fundamental limitation of previous research: the reliance on theoretical references, global averages (such as INRIX/TomTom indices for urban speeds), or data from different cities (like the Amazon dataset in the United States or studies from London and Paris)8 when comparing van performance.
Second, it addresses the potential interpretation bias that comes from comparing vans and cargo bikes from different operators, where results could be influenced by operator-specific factors such as the nature of delivery flows, internal processes, organisational structure, specifics of local urban environment, and the level of courier training and professionalism. This study offers a true like-for-like analysis comparing cargo bikes and vans delivering equivalent flows in the same areas for the same operator, providing a direct measure of relative efficiency.
What makes this study particularly valuable is that it examines a successful transition - KGS Group started with vans, introduced cargo bikes in 2022 after observing their potential advantages, and has since dramatically expanded their use based on clear operational benefits. The results were so striking that KGS Group completely transformed their operations, moving from a pilot to a comprehensive integration of cargo bikes into their delivery fleet. This transition was driven not just by sustainability goals, but by compelling evidence of improved operational efficiency and commercial performance in dense urban areas.
The study analyses:
This comprehensive dataset allows us to move beyond theoretical comparisons to understand the real-world performance differences between vans and cargo bikes across different urban environments. By examining factors such as hub location impacts, stem distances, the impact of urban area characteristics, vehicle type performance and the effects of route density, we can provide concrete evidence of where and when each vehicle type performs best, helping inform strategic decisions not only for KGS Group but for the broader e-commerce delivery sector.
1.4Vehicle Comparison Overview
Fleet managers and logistics operators face complex trade-offs when considering their vehicle mix for urban deliveries. To frame these choices, it's useful to first understand the known strengths and limitations of each vehicle type.
Until recently, perceived limitations of cargo bikes and LEVs have slowed their wider adoption in urban logistics. These commonly cited concerns focus on their lower carrying capacity, limited operational range, and presumed lower efficiency compared to vans. However, as our analysis will demonstrate, many of these perceived weaknesses are overstated or can be effectively managed through proper operational planning.
Cargo bikes and Light Electric Vehicles (LEVs) come in various configurations9, including two-wheeled cargo bikes, three-wheeled variants, four-wheeled vehicles, and models that can be equipped with trailers for additional capacity. Despite their differences, these vehicles share some common characteristics: they typically have lower carrying capacity and more limited range compared to vans, but are minimally impacted by traffic congestion, benefit from easy parking, and can access dense urban areas and zones with vehicle restrictions.
Traditional vans, in contrast, offer much higher carrying capacity and can cover greater distances between depot returns. However, they face significant operational challenges in urban environments: they are heavily impacted by congestion, struggle with parking in dense areas, and increasingly face access restrictions in city centres.
The key operational characteristics that fleet managers must consider when comparing these vehicles include:
Access capabilities: While vans may be restricted from entering certain urban zones (pedestrian areas, modal filters, one-way streets), cargo bikes and LEVs often have greater flexibility in route choice and can access these restricted areas. This can be particularly valuable in historic city centres or areas with traffic calming measures.
Loading capacity: Vans offer significantly higher carrying capacity per trip, allowing them to serve more customers before returning to the depot. However, this advantage must be weighed against potential difficulties in accessing dense urban areas and finding suitable parking. LEVs and cargo bikes, while more limited in capacity, often compensate through greater operational efficiency in congested areas.
Operational range: The distance vehicles can cover between returns to the depot impacts the overall logistics network design. Vans can operate effectively from peripheral depots, while cargo bikes and LEVs typically require strategically placed urban micro-hubs to optimize their operations.
Infrastructure requirements: Different vehicle types have varying infrastructure needs for parking, charging, and maintenance. While vans require standard loading bays and parking spaces, cargo bikes and LEVs can often use more flexible parking solutions and may need secure overnight storage and charging facilities.
Understanding these characteristics is essential for optimising fleet composition and deployment strategies. Through our analysis of KGS Group's successful transition, we will demonstrate how many perceived limitations of cargo bikes can be overcome, and how their operational advantages can significantly outweigh their constraints in urban environments.
2Methodology & Data Sources
2.1Data Collection
To ensure robust analysis of urban delivery performance, we used three primary data sources. First, we collected data from GPS trackers installed on four cargo bikes in the KGS fleet. Second, we accessed the Delivery Management System (DMS) data for all vehicles, which included data about task status, sequence information and delivery attempts. Third, we used PDA tracker data, which provided delivery timestamps and low-resolution GPS data at intervals of 3-5 minutes.
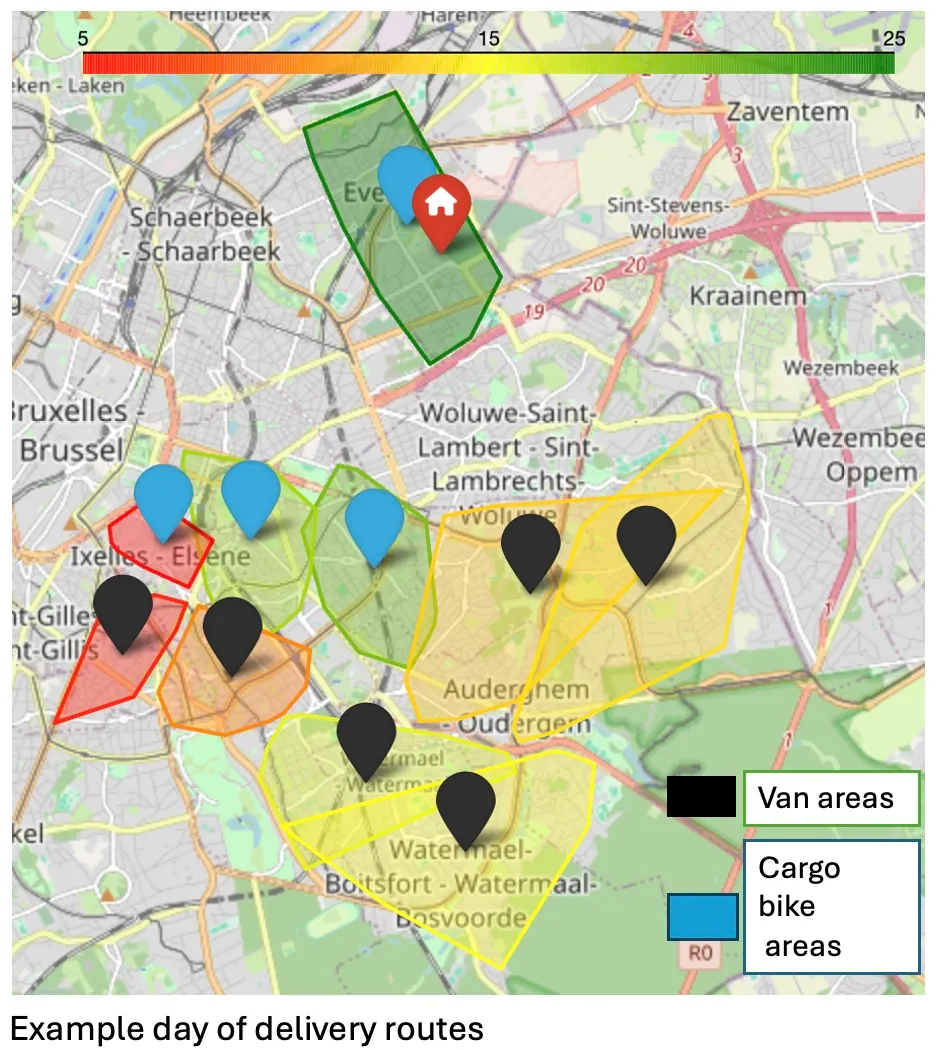
Data collection covered 32 days of deliveries: 345 routes and 32,547 deliveries across urban contexts from the dense city centre to suburban areas.
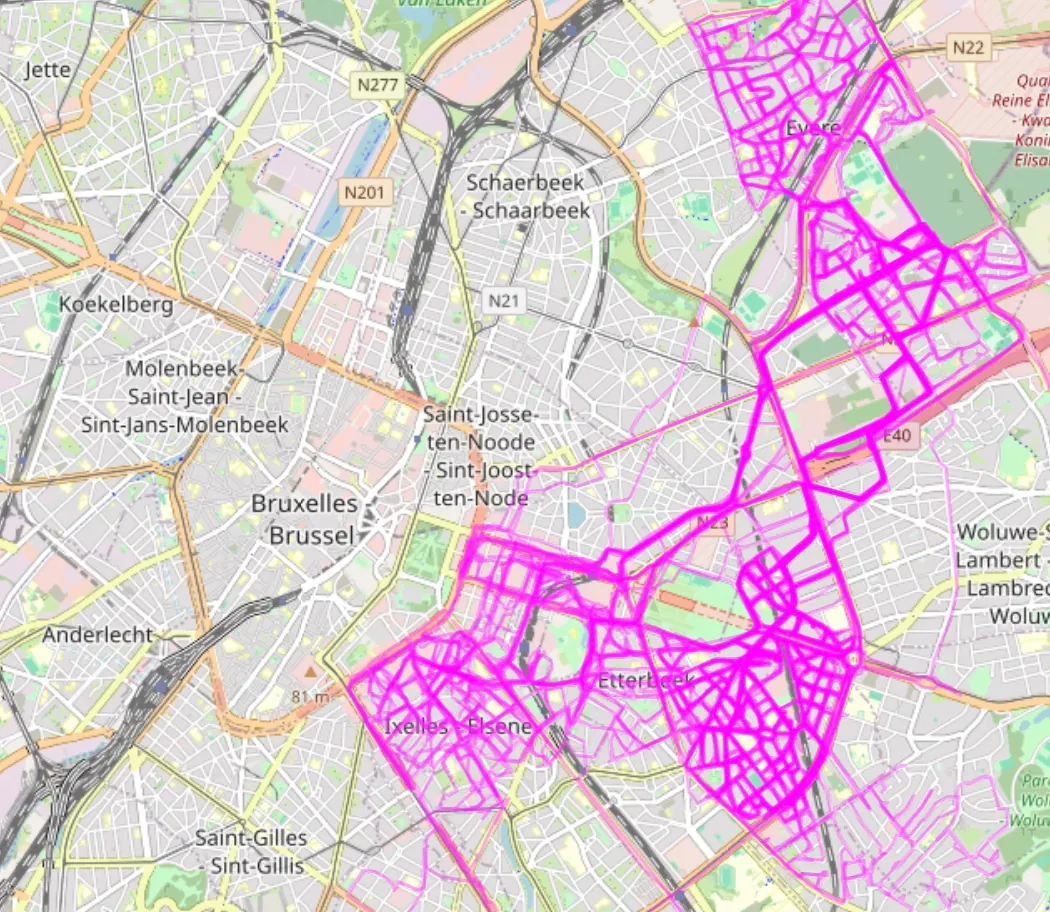
Below we show the GPS traces of the cargo-bikes, overlayed over the month of September, showing the fine gridding of the delivery areas considered.
2.2Route Reconstruction
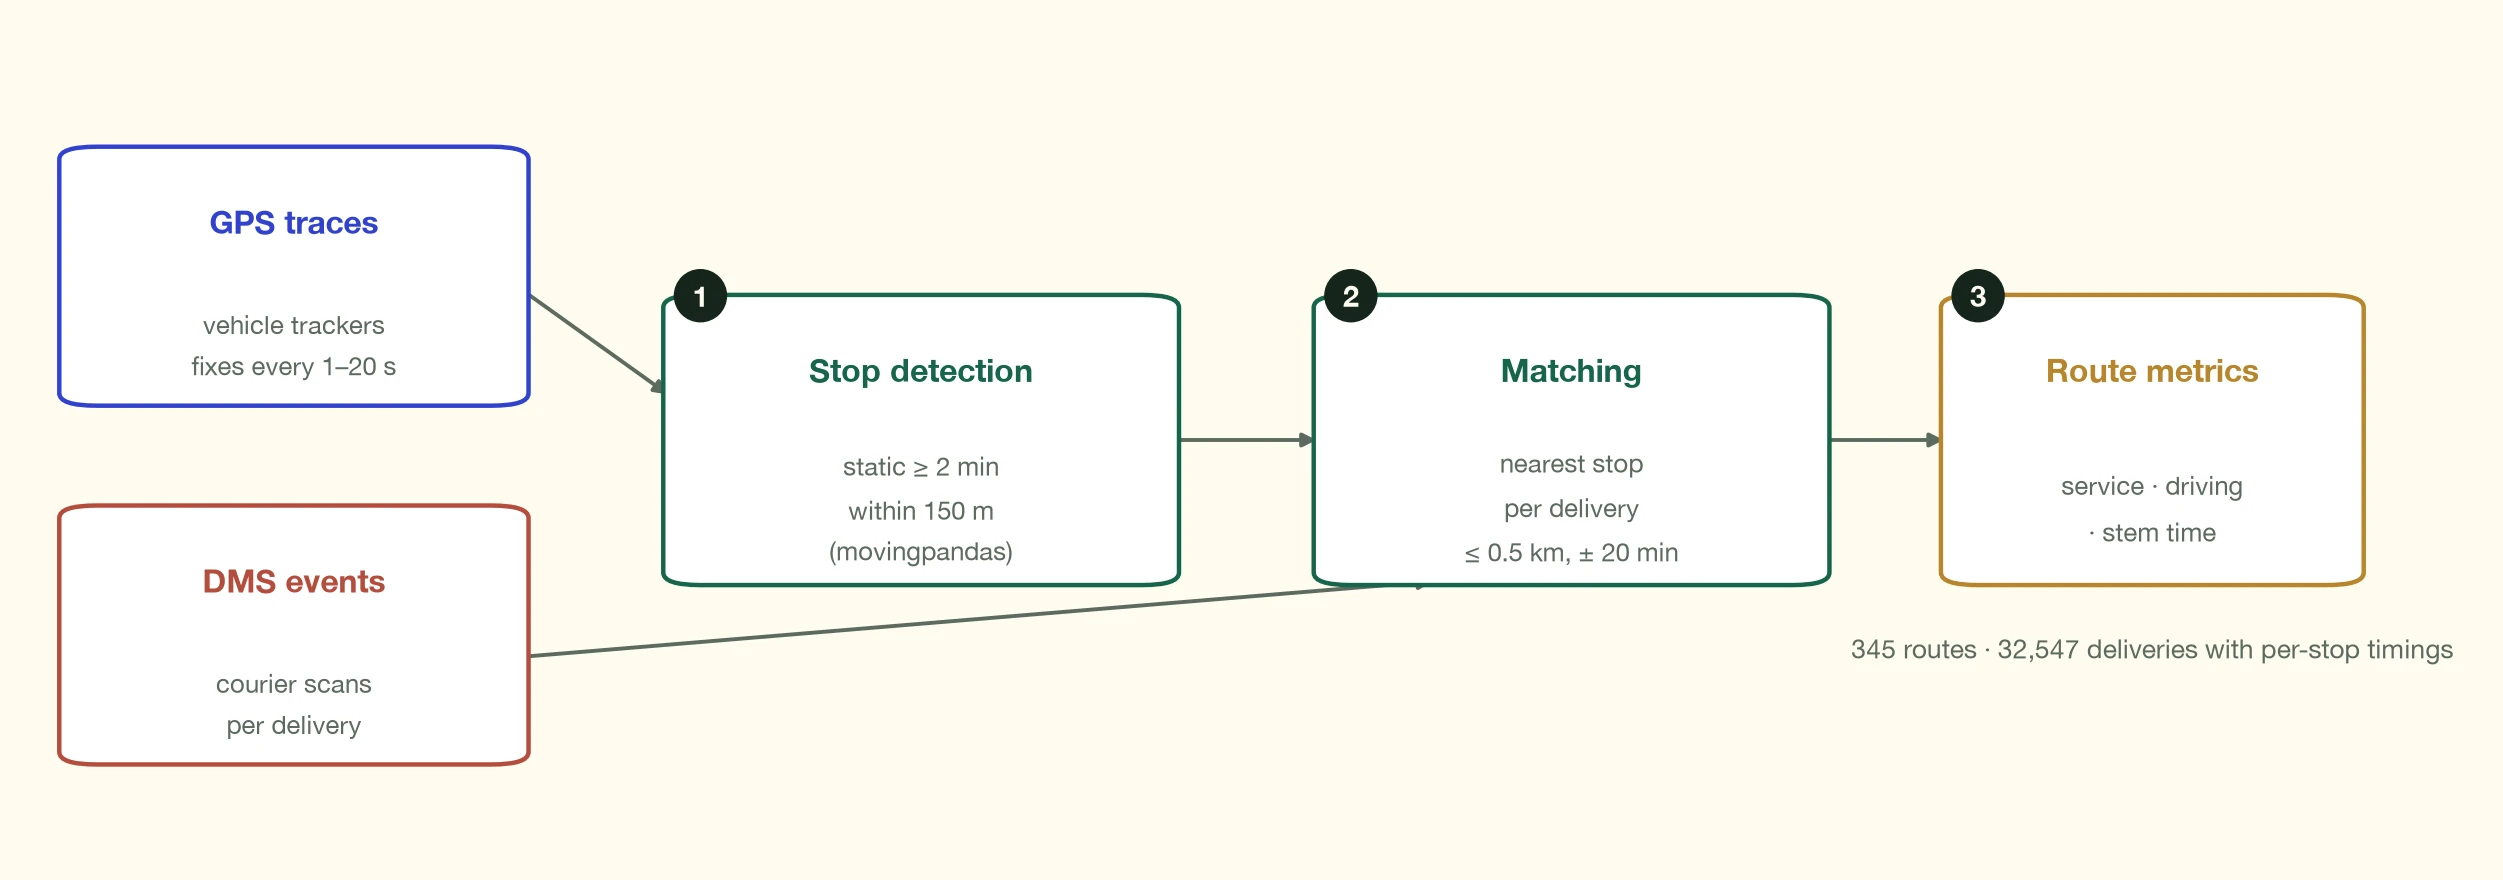
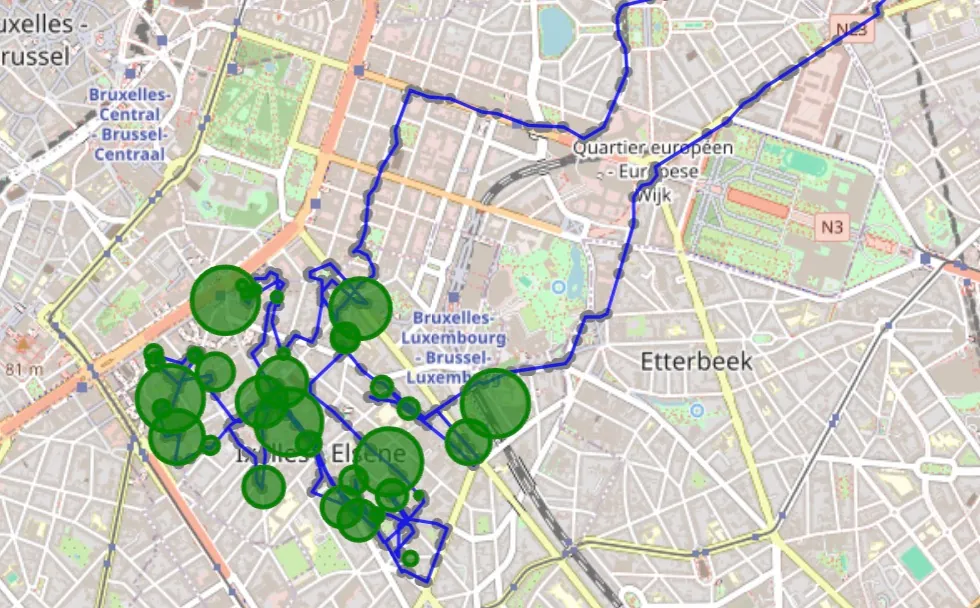
We used two methods to reconstruct delivery routes. For vehicles equipped with GPS trackers, we matched the GPS data to the DMS data. This involved analysing where stops happened during a GPS trace, and designing a matching algorithm to connect the GPS stops to each delivery on a delivery route.
For vehicles without GPS data, we used Google Maps to trace routes between PDA points. In this case, we applied car directions for distances over 300m and walking directions for distances under 300m to avoid unrealistic detours where a driver would be more likely to walk.
To study delivery routes, we separate each leg into driving time and service time. This allows us to both compute statistics at the route level, while also understanding the patterns at a more fine-grained level. See Appendix 8.2, for details on how service times were computed across routes. See also Appendix 8.3 to explain our service time metrics, focusing on time per delivery and not per stop.
2.3Geospatial Analysis Framework
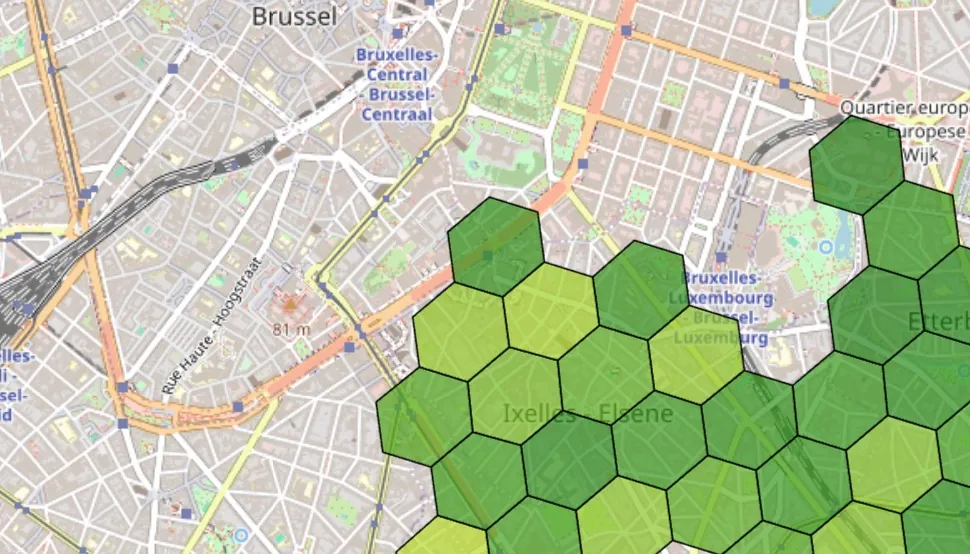
In our study, we use the Uber Hexagonal Hierarchical Spatial Index (H3) to analyse vehicle performance across different urban contexts. Instead of relying on predefined boundaries, the H3 system divides the world into consistent hexagonal cells. This method offers a standardised approach, akin to overlaying a grid on a map.
2.3.1Dividing Brussels into urban areas
To study service times, we divide Brussels in different areas. To do this, we follow the methodology of Schrader et al. (2024)8 also described in a previous data-driven study conducted with Urbike in Brussels (Kale AI, 2023)7.
In short, we use OpenStreetMap tags (e.g. number of buildings, type of road, points of interest, tourism etc) present in each hexagon, as well as the population density, enriching our hexagonal segmentation with fine-grained details of infrastructure and land use.
This allows us to model how built environment factors like density and road patterns influence delivery productivity. In contrast to coarse administrative units, our approach provides a flexible yet standardised framework to study how local urban contexts relate to vehicle performance.
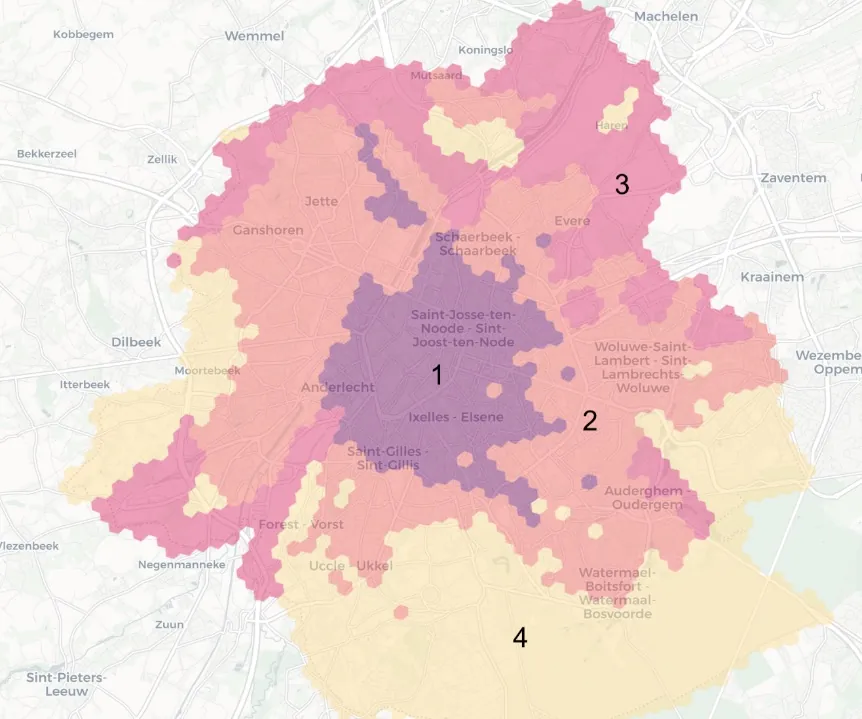
We compress this information into small vectors (embeddings) that describe the urban micro-region (i.e. one specific hexagon). These micro-region vectors are then clustered by similarity, to define four different types of urban areas for Brussels. The complexity of urban space means that this is not an exact science, but it helps us broadly segment the city. This allows us to understand how urban context affects the performance of vans and cargo bikes. Using this methodology, the map below divides Brussels into four distinct urban area types. We describe them as follows: 1) Core area (or urban centre), 2) Urban area, 3) Dense suburban, 4) less dense suburban.
2.4Performance Metrics
To compare van and cargo bike performance, we established several key metrics:
- Deliveries per hour
- Distance travelled per delivery
- Service time per delivery
- Route density (deliveries per km)
- Total route duration
- Share of route time in service (parking, walking, door)
- Performance variation across the four Brussels zone types
These metrics were designed to capture both the operational efficiency of different vehicle types and how their performance varies across different urban contexts. In general, in this report we focus mostly on the service time of vehicles. We do this for two reasons. First, while we had GPS trackers installed on cargo bikes. We did not have GPS trackers installed on vans so are not able to study the vehicle speed to compare the vehicle performances. We are able to estimate the service times for vans from the PDA geo-location data (which provides location updates much less frequently than GPS) and from the TMS data. Second, service time is a much more significant portion of a day of deliveries, making up 60% of a driver’s day (and more if excluding the time commuting to and from the hub). This is broken down in Appendix 8.1.
3Efficiency Analysis: Cargo Bikes vs. Vans
3.1Overall Performance Metrics
Delivery Rates and Efficiency
The data visualisation presents overview statistics of the delivery rounds conducted by cargo-bikes (n=153) and vans (n=192) across three key metrics: Number of Deliveries per Route, Deliveries per Hour, and Deliveries per Km.
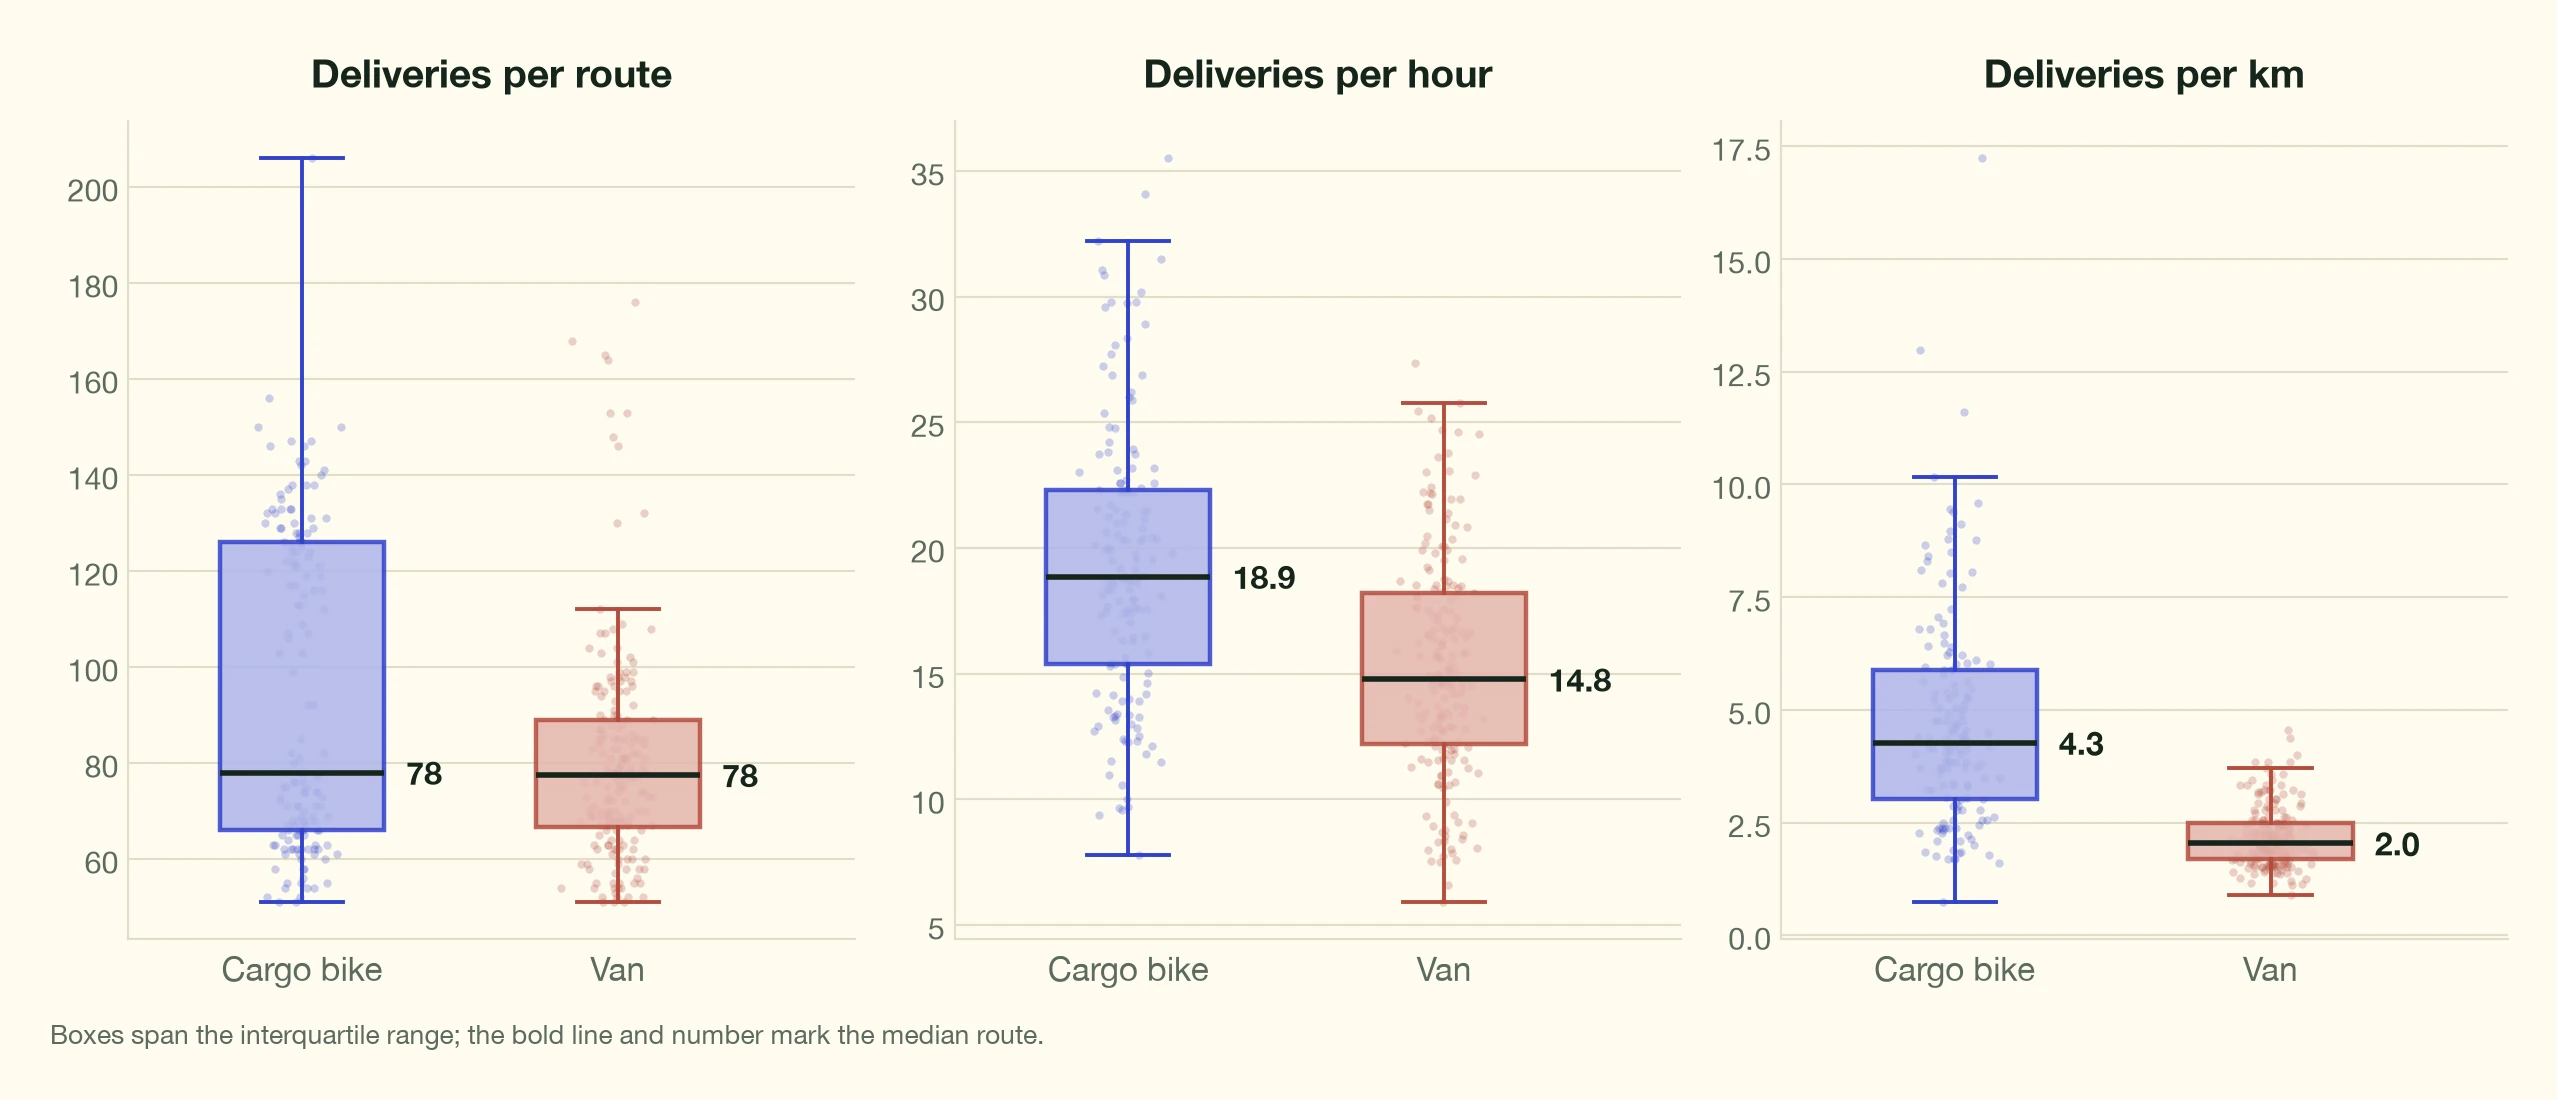
Each dot represents a route executed either by a cargo-bike or a van. We compare the number of deliveries per route for each vehicle type in the dataset, the number of deliveries per hour and the density (i.e. deliveries per km) to highlight the differences between cargo-bike and van routes.
In terms of efficiency, cargo bikes demonstrate a clear advantage, though with high variance.
The median deliveries per hour for cargo bikes (18.85) is significantly higher than that of vans (14.77). Notably, cargo bikes rarely drop below 12 deliveries per hour and can achieve much higher efficiency levels, with some instances exceeding 30 deliveries per hour. Vans show a lower efficiency range, sometimes dropping to between 5 and 10 deliveries per hour, and never exceeding 25.
Number of Deliveries per Route
The distribution of deliveries per round shows distinct patterns for cargo bikes and vans. Cargo bikes exhibit a bi-modal distribution, with one cluster between 50-80 deliveries and another between 100-150 deliveries per round. This suggests two different usage patterns, possibly reflecting variations in route types or delivery densities. Although not too frequent, KGS also pointed out that the cargo-bikes are sometimes reloaded dynamically by a van and thus execute “double rounds”. Vans show a more concentrated distribution, typically handling between 50 and 110 deliveries per round.
Route Density Patterns
The most striking difference appears in the route density metric. Cargo bike routes show a wide distribution, ranging from 2 to 10 deliveries per km, with a median of 4.27. In contrast, van routes are tightly clustered between 1 and 4 deliveries per km, with a median of 2.04. This substantial difference in route density highlights how these vehicle types are used with distinct operational roles.
3.2Urban Zone Performance
Delivery Performances in the City Centre: Cargo-bikes vs Vans
Here we look at how long delivery vehicles (vans and cargo bikes) typically spend making stops in different parts of the city. The city is divided into four zones, with Core Area being the busy city centre and Less Dense Suburban area being the outskirts. We study this in the figure below (Figure 7) across the different urban zone (one graph per zone).
The most striking finding is in the Core Area, where cargo bikes (green) can complete most deliveries much faster than vans (blue) - typically in about 2 minutes versus 3 minutes for vans. This advantage of cargo bikes becomes less pronounced as you move away from the city centre, with both vehicles showing more similar delivery times in outer zones. This suggests cargo bikes are particularly efficient in congested urban areas where vans might struggle with parking and navigation.
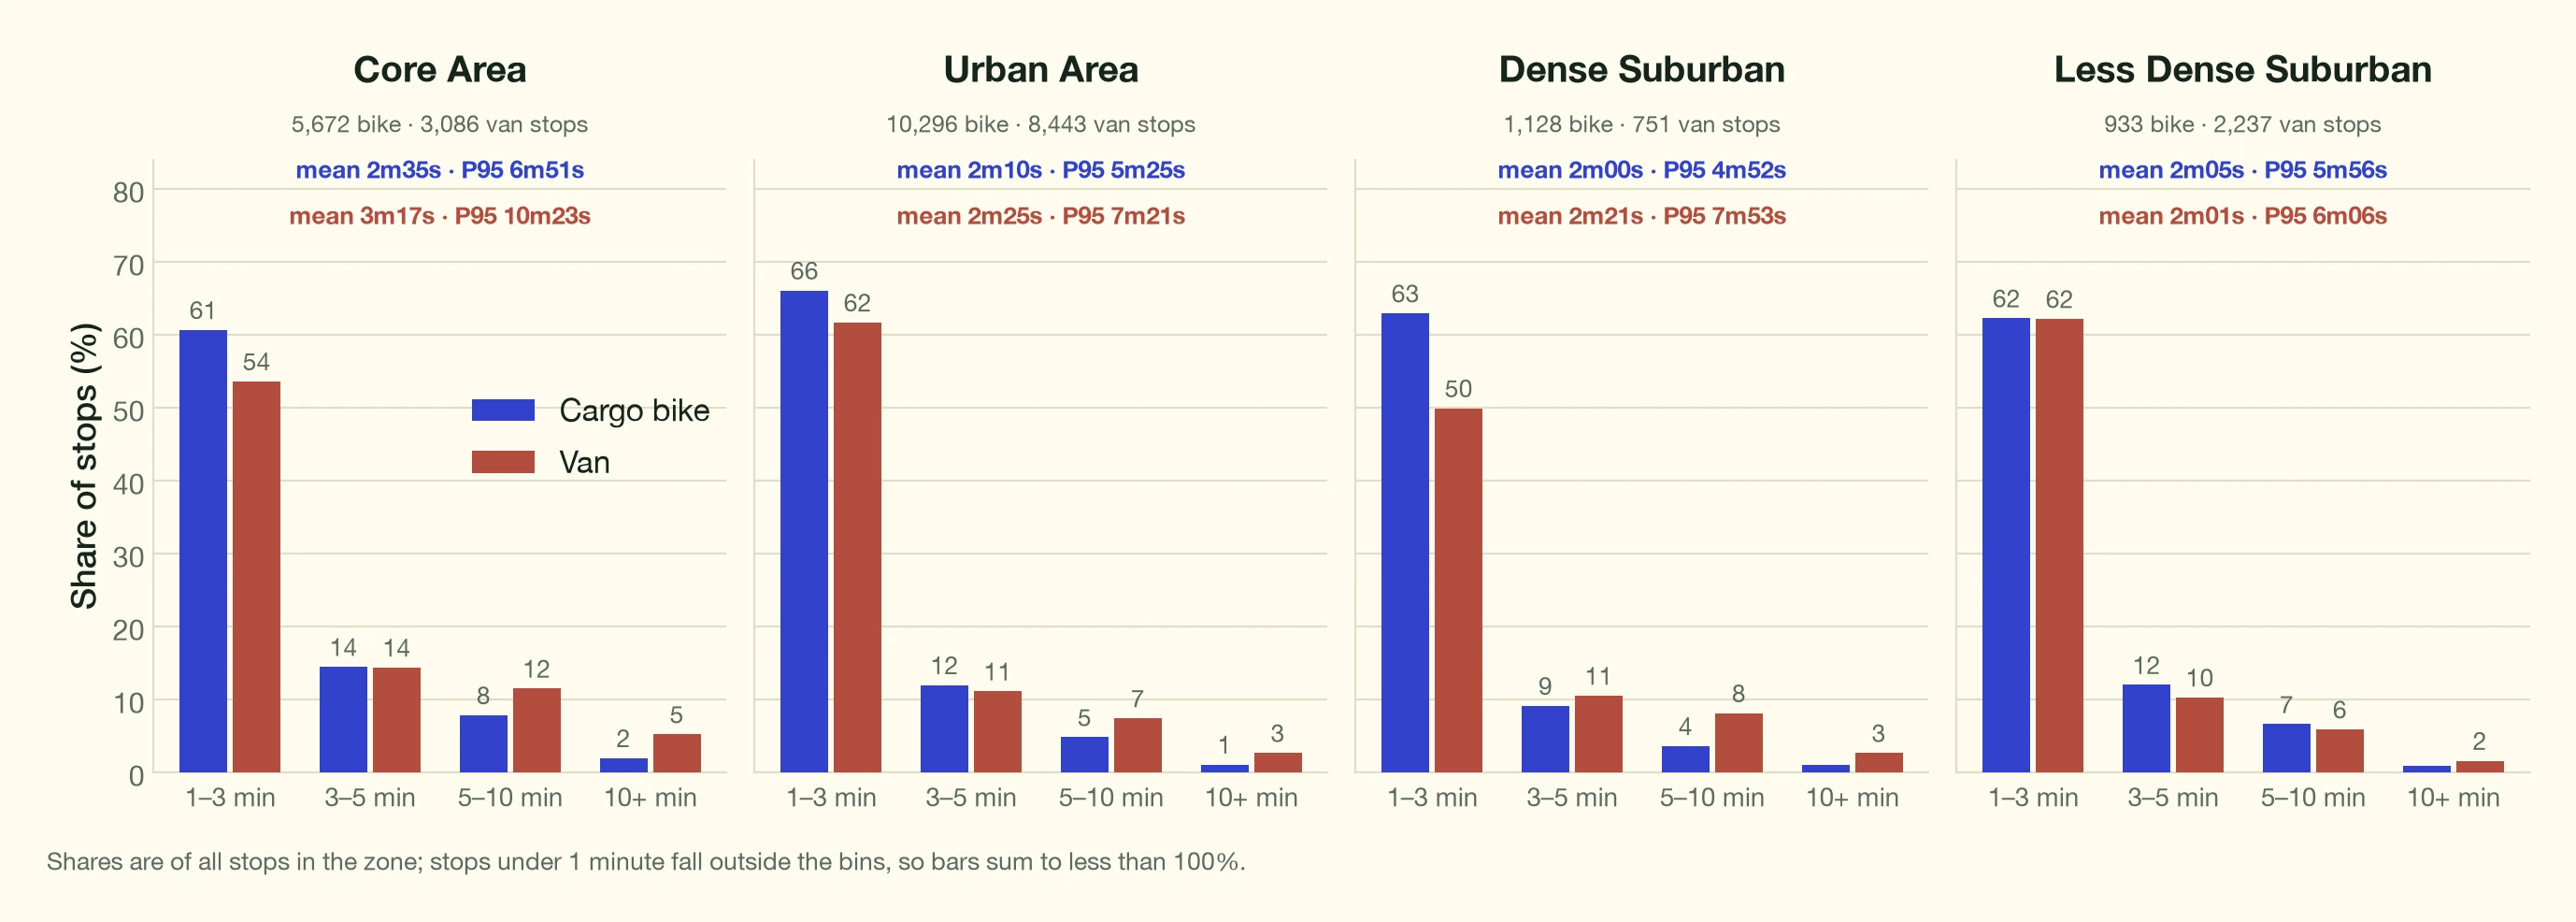
In dense urban centres, the performance gap between vehicles is most pronounced. Cargo bikes demonstrate remarkable advantages:
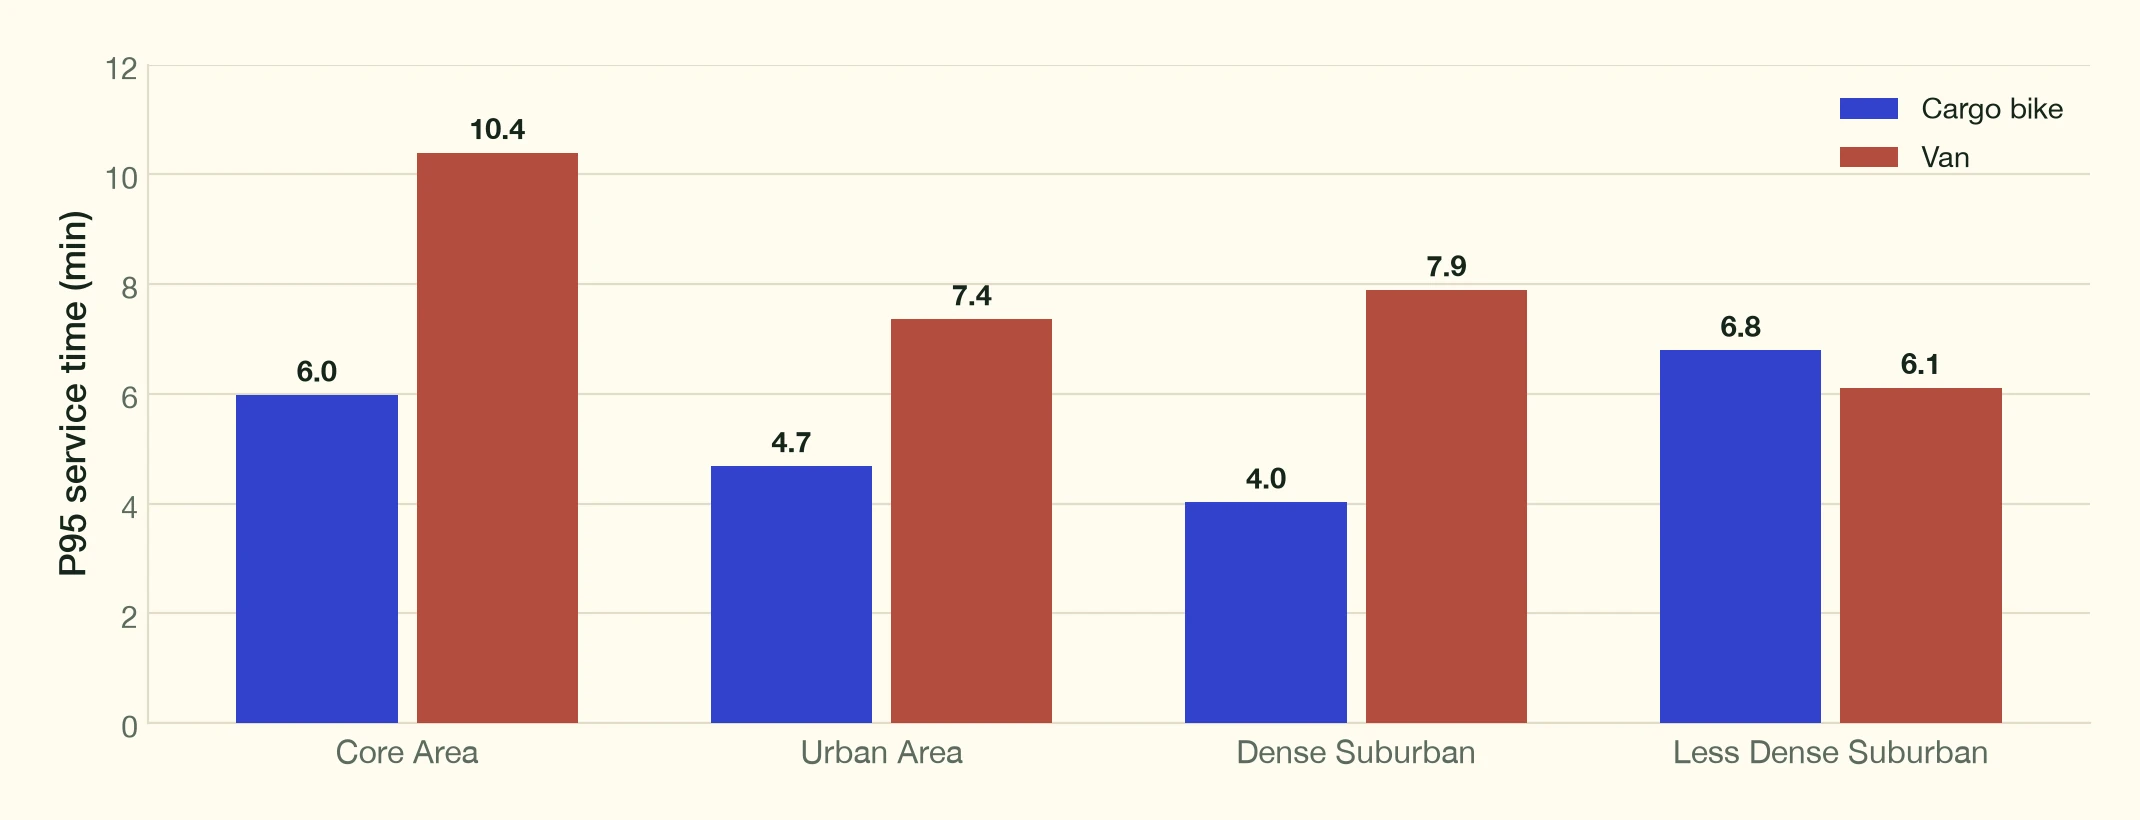
In urban logistics, while many deliveries happen efficiently without issues, a few deliveries go very wrong and become big time sinks. Because of this, having an idea of "how often do bad things happen?" and "how bad do things get?" are important markers. To measure this, we look at the 95th percentile service time (P95) - the time threshold that 95% of deliveries fall under, with only the worst 5% taking longer.
In dense urban areas, when things go wrong, they go much more wrong for vans. In the worst 5% of cases, van deliveries can take up to 10.5 minutes, while cargo-bikes rarely exceed 6.5 minutes even in difficult situations. The advantage is concentrated where density is highest: at the least dense suburban fringe, where cargo bikes have least to gain, the two vehicles are line-ball on the worst cases and vans hold a slight edge.
Looking at the five most challenging areas of the city (each hexagon covering approximately 0.7 km²), the contrast becomes stark.
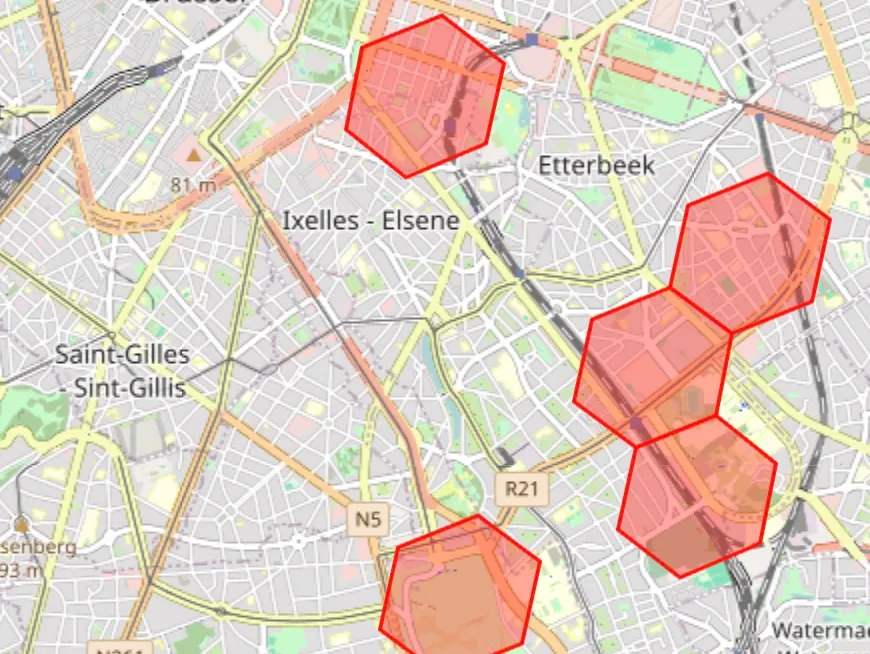
While cargo-bikes maintain reasonable average service times of 2.4 minutes in these difficult zones, vans struggle with averages of 4.2 minutes - nearly twice as long (and a 3-hour difference per vehicle per day for 100 deliveries). The P95 times reveal an even bigger gap: in these challenging areas, van P95 times reach 14.5 minutes, while cargo-bike P95 times stay at just 5.8 minutes - a difference of 8.7 minutes per problematic delivery.
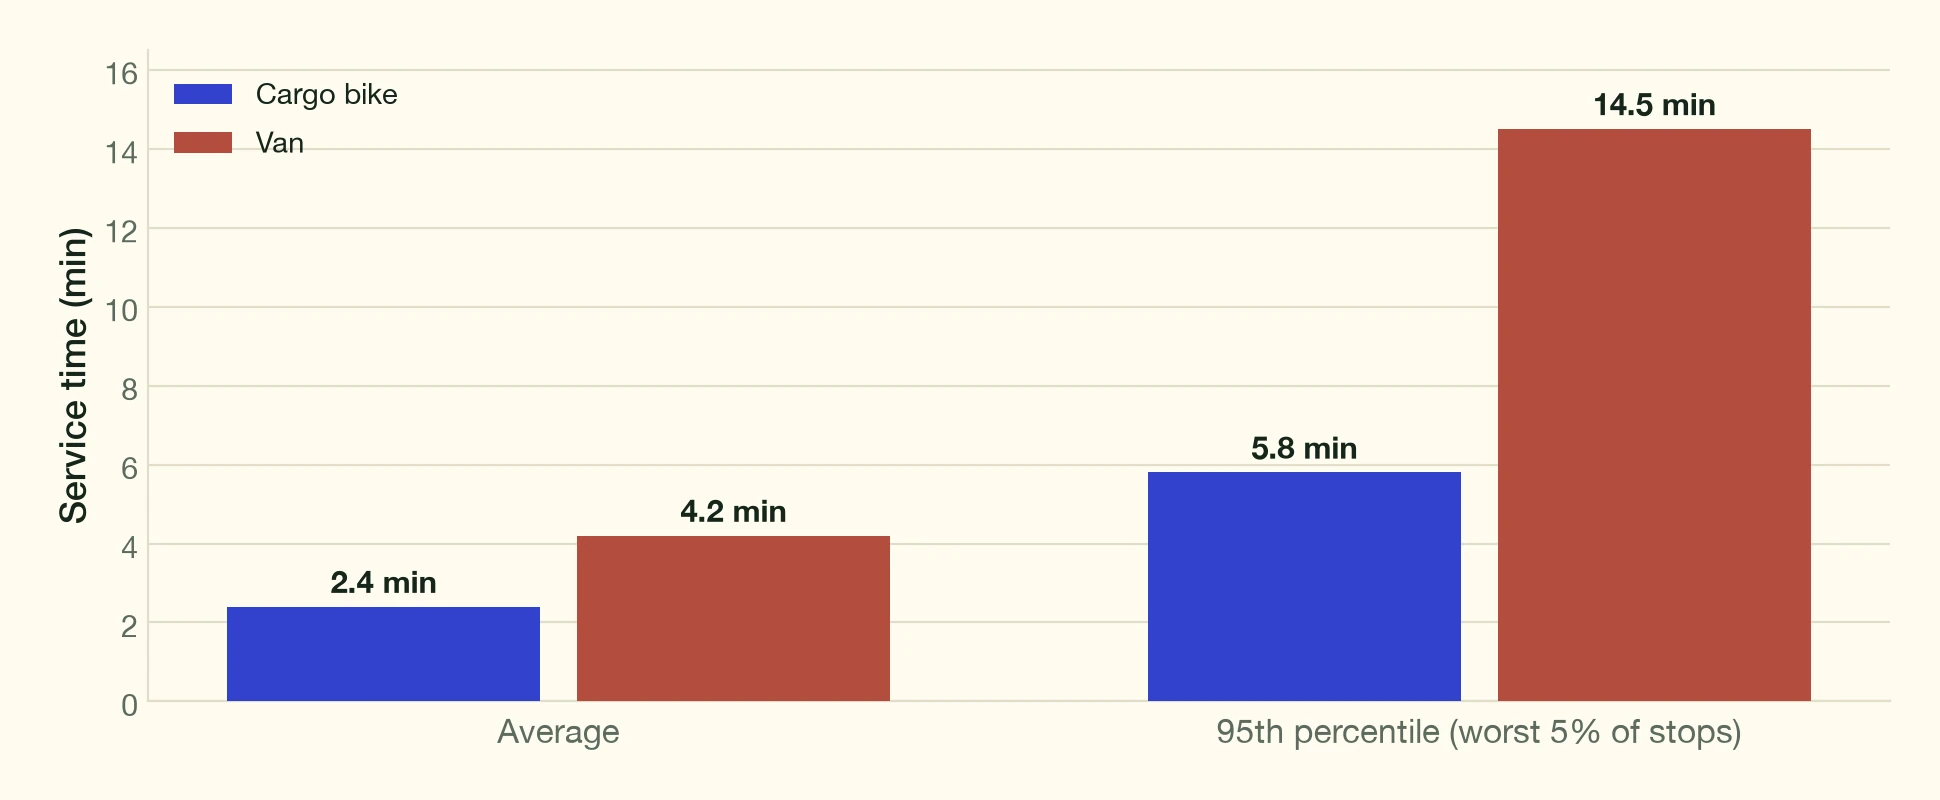
These areas demonstrate how van deliveries can become extraordinarily time-consuming in challenging urban environments, while cargo-bikes maintain relatively consistent performance even under difficult conditions.
What makes these findings even more compelling is that we have only focused on studying service time - the time spent at each delivery point. Cargo-bikes enjoy several additional advantages over vans in dense urban areas.
They can maintain higher average speeds by using bike lanes and avoiding traffic congestion that regularly slows vans to a crawl. They have superior access to their destinations and are often able enter pedestrian zones where vans are restricted. They can also take more direct routes through city centres, using contraflow lanes, shortcuts through parks, and avoiding one-way street systems that force vans to take longer routes. When you factor in these travel time advantages on top of the service time savings we've measured, the real-world efficiency gain of cargo-bikes over vans in urban areas is likely even higher than what our service time data suggests.
Service Time Variations Across the City
To better understand how these performance differences manifest across the urban landscape, we mapped service times across different micro-regions of the city. The spatial analysis reveals a clear pattern: van service times are significantly impacted by urban context, with central areas showing markedly longer service times. Cargo bikes, in contrast, maintain more consistent service times across different urban zones
This spatial pattern is particularly pronounced in Brussels' city centre, where the difference in performance between the two vehicle types is most stark.
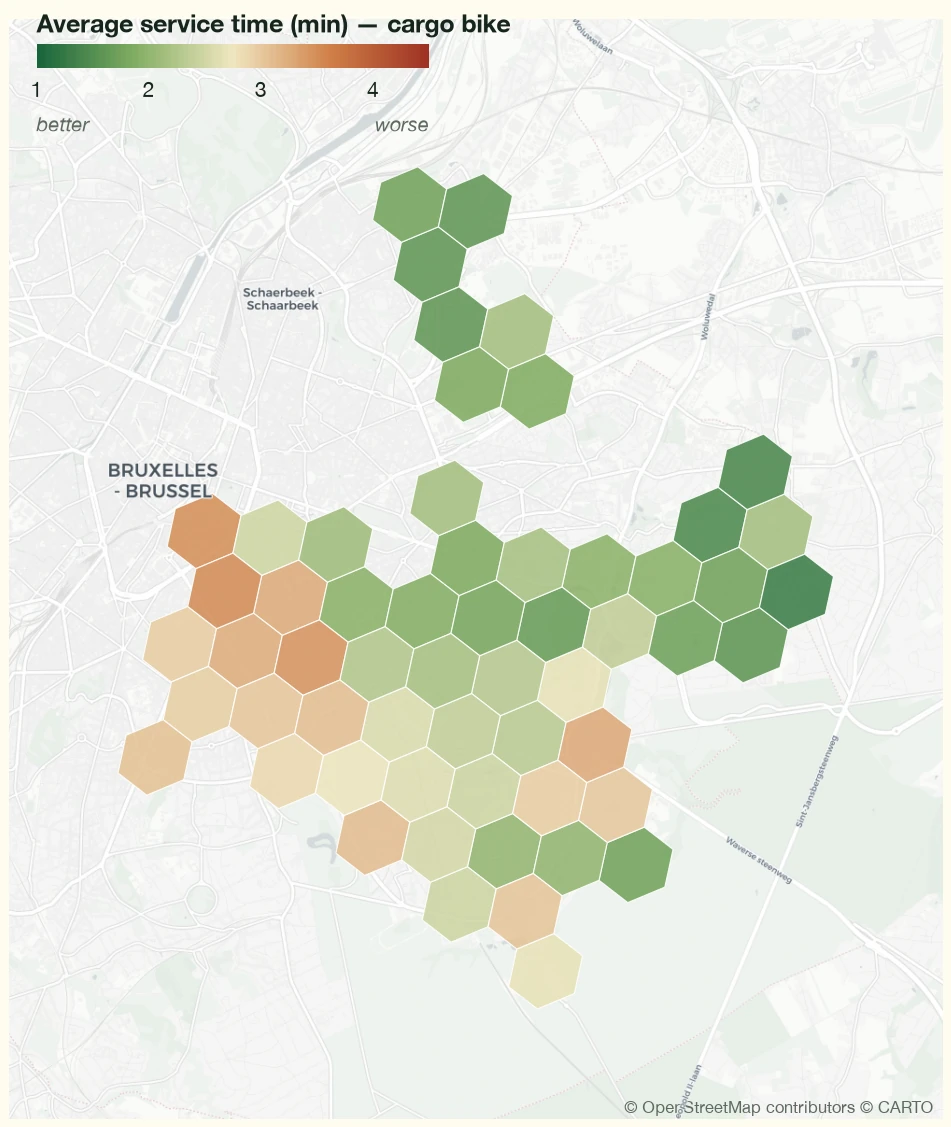
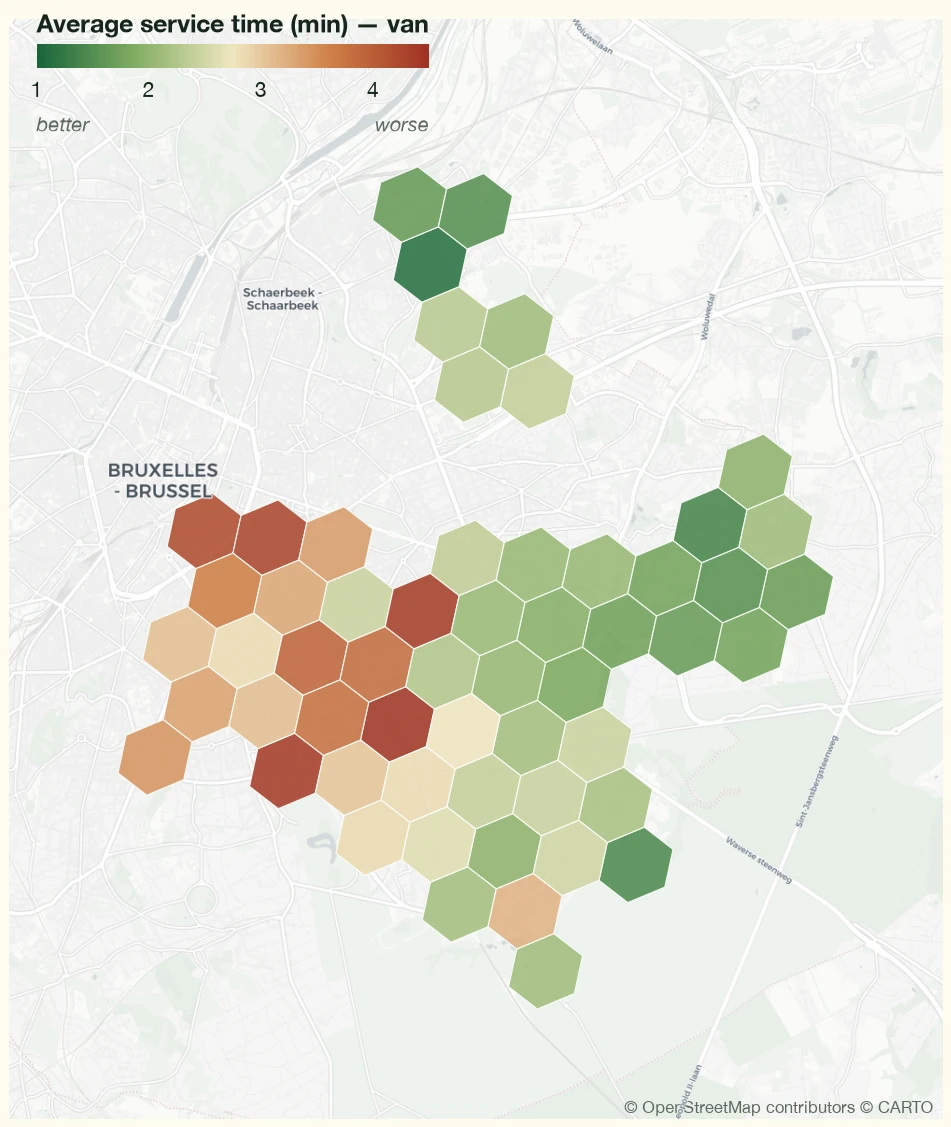
However, the most compelling advantage of cargo bikes emerges when examining delivery reliability. While average service times tell part of the story, the "worst case" scenarios - represented by the 95th percentile of service times - reveal an even more significant contrast:
For vans, outlier deliveries in many central areas can take 12-15 minutes; For cargo bikes, even the worst deliveries rarely exceed 8 minutes
.
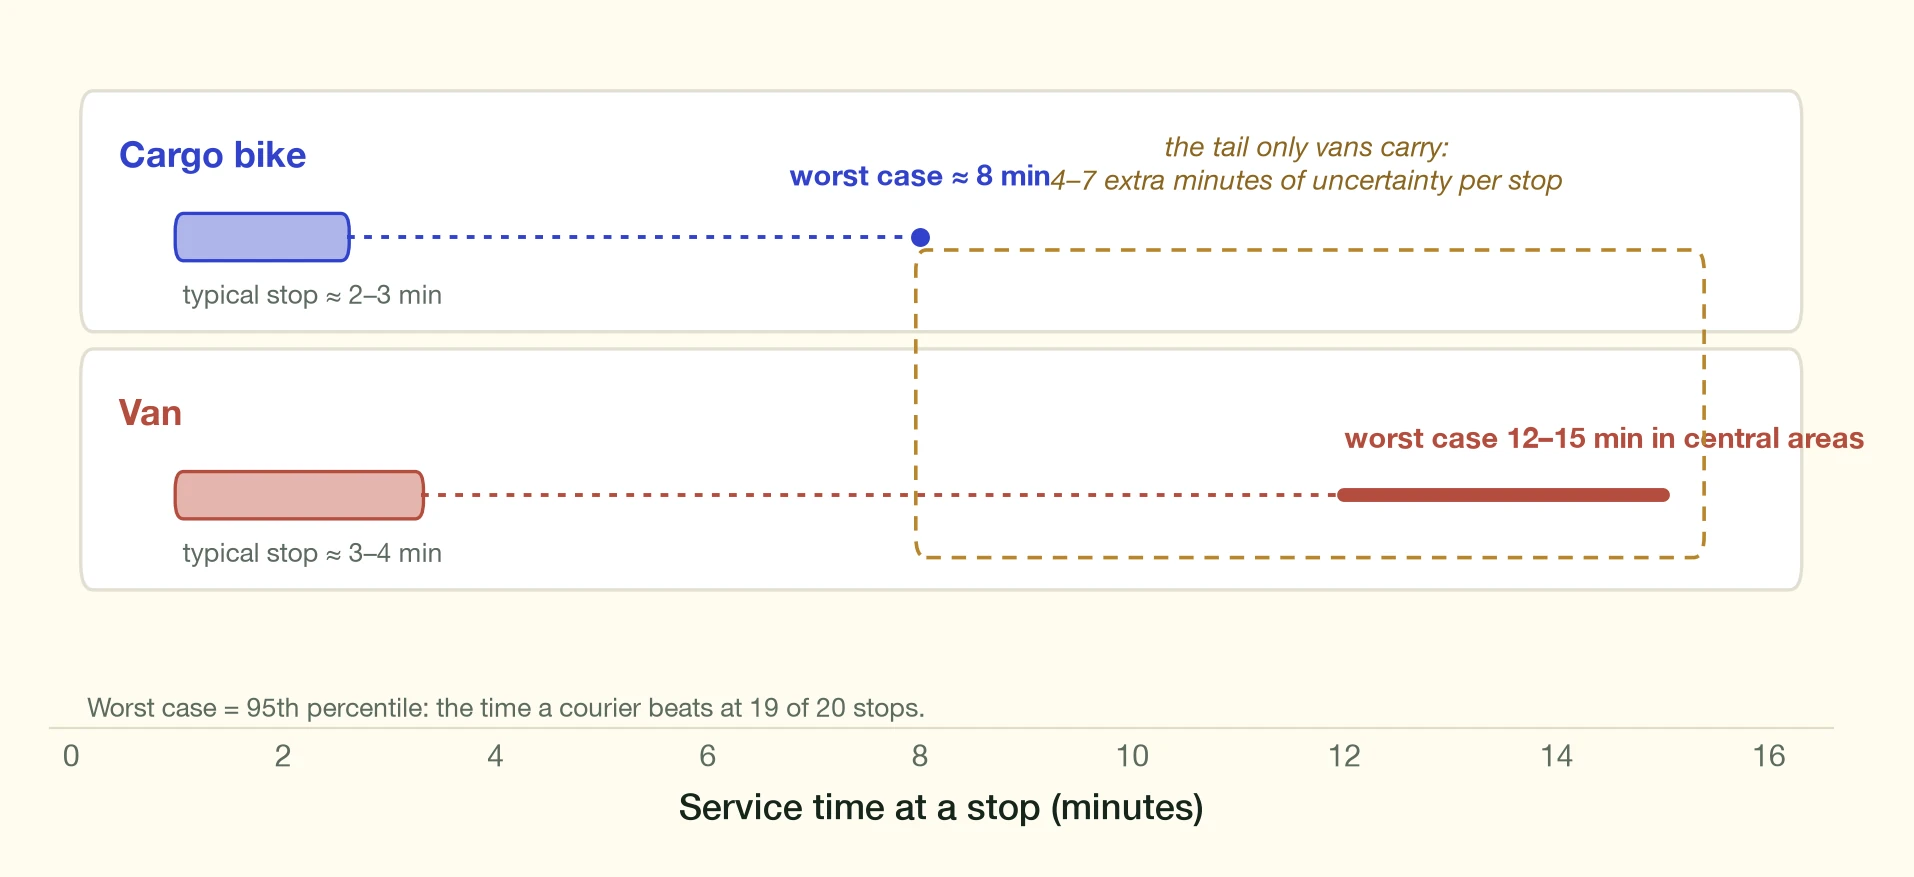
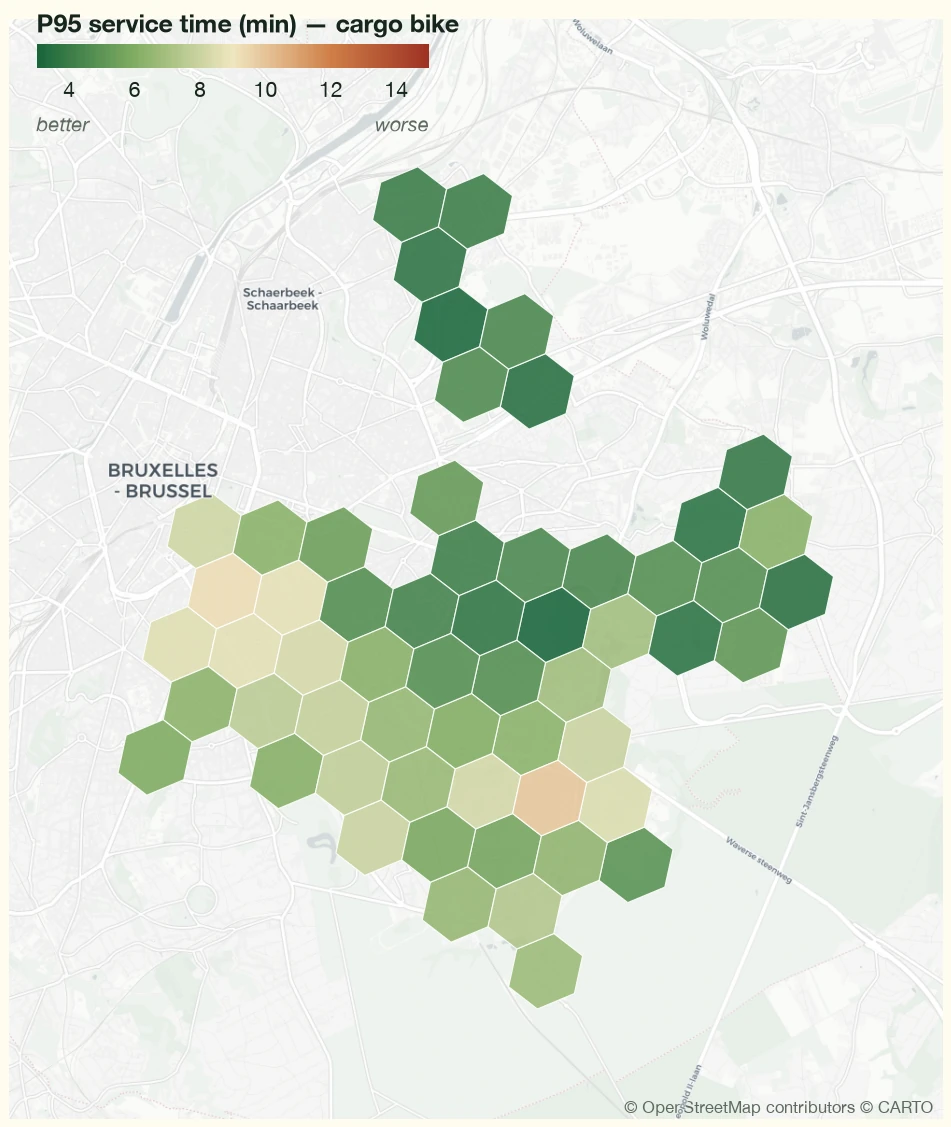
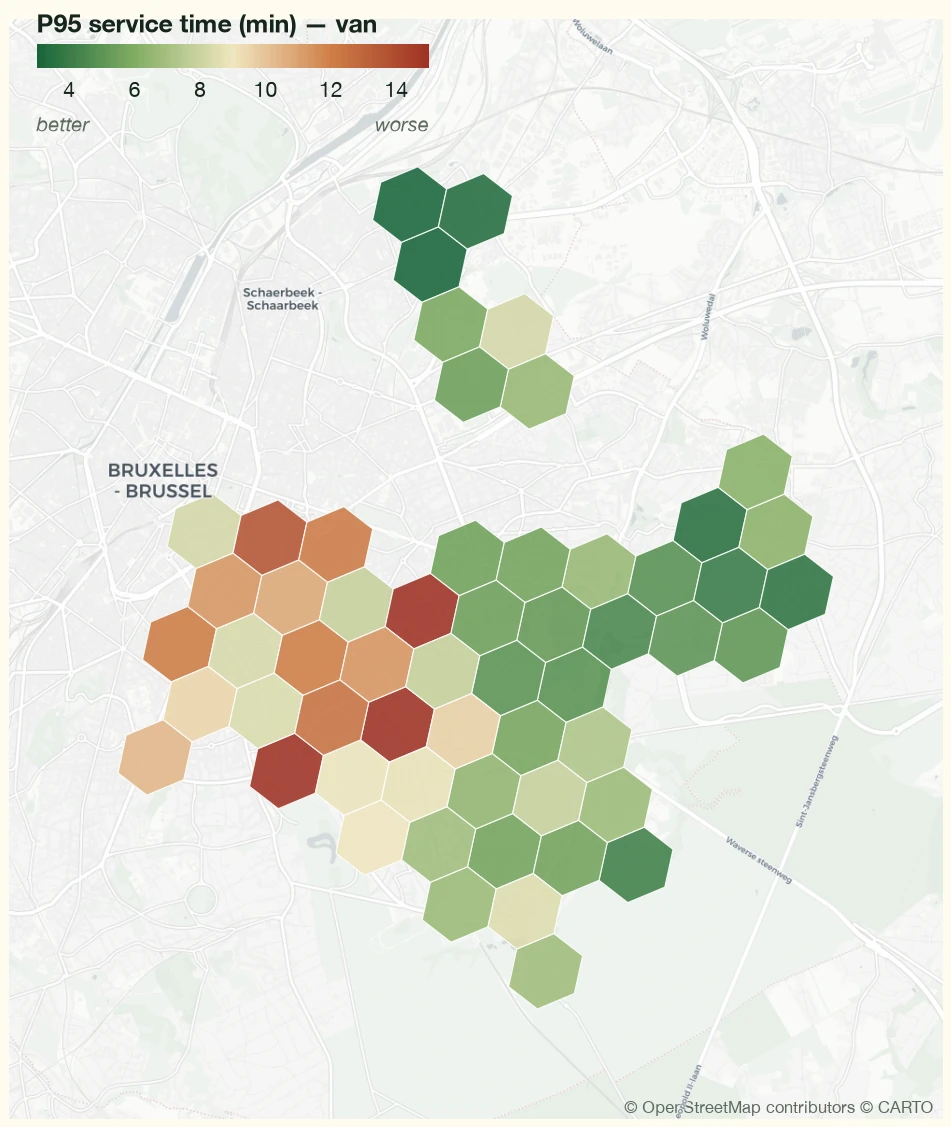
This stark difference in reliability translates into more predictable delivery schedules, easier route planning, better customer service, and more efficient fleet utilisation. The combination of faster average performance and lower variability makes cargo bikes particularly advantageous for dense urban logistics operations.
Impact of Urban Density
The relationship between route density and delivery efficiency provides valuable insights into KGS Group's vehicle deployment strategy in Brussels. The visualisation demonstrates how vehicle performance varies across different delivery densities (while excluding stem distance and stem duration) to focus on the core delivery operations.
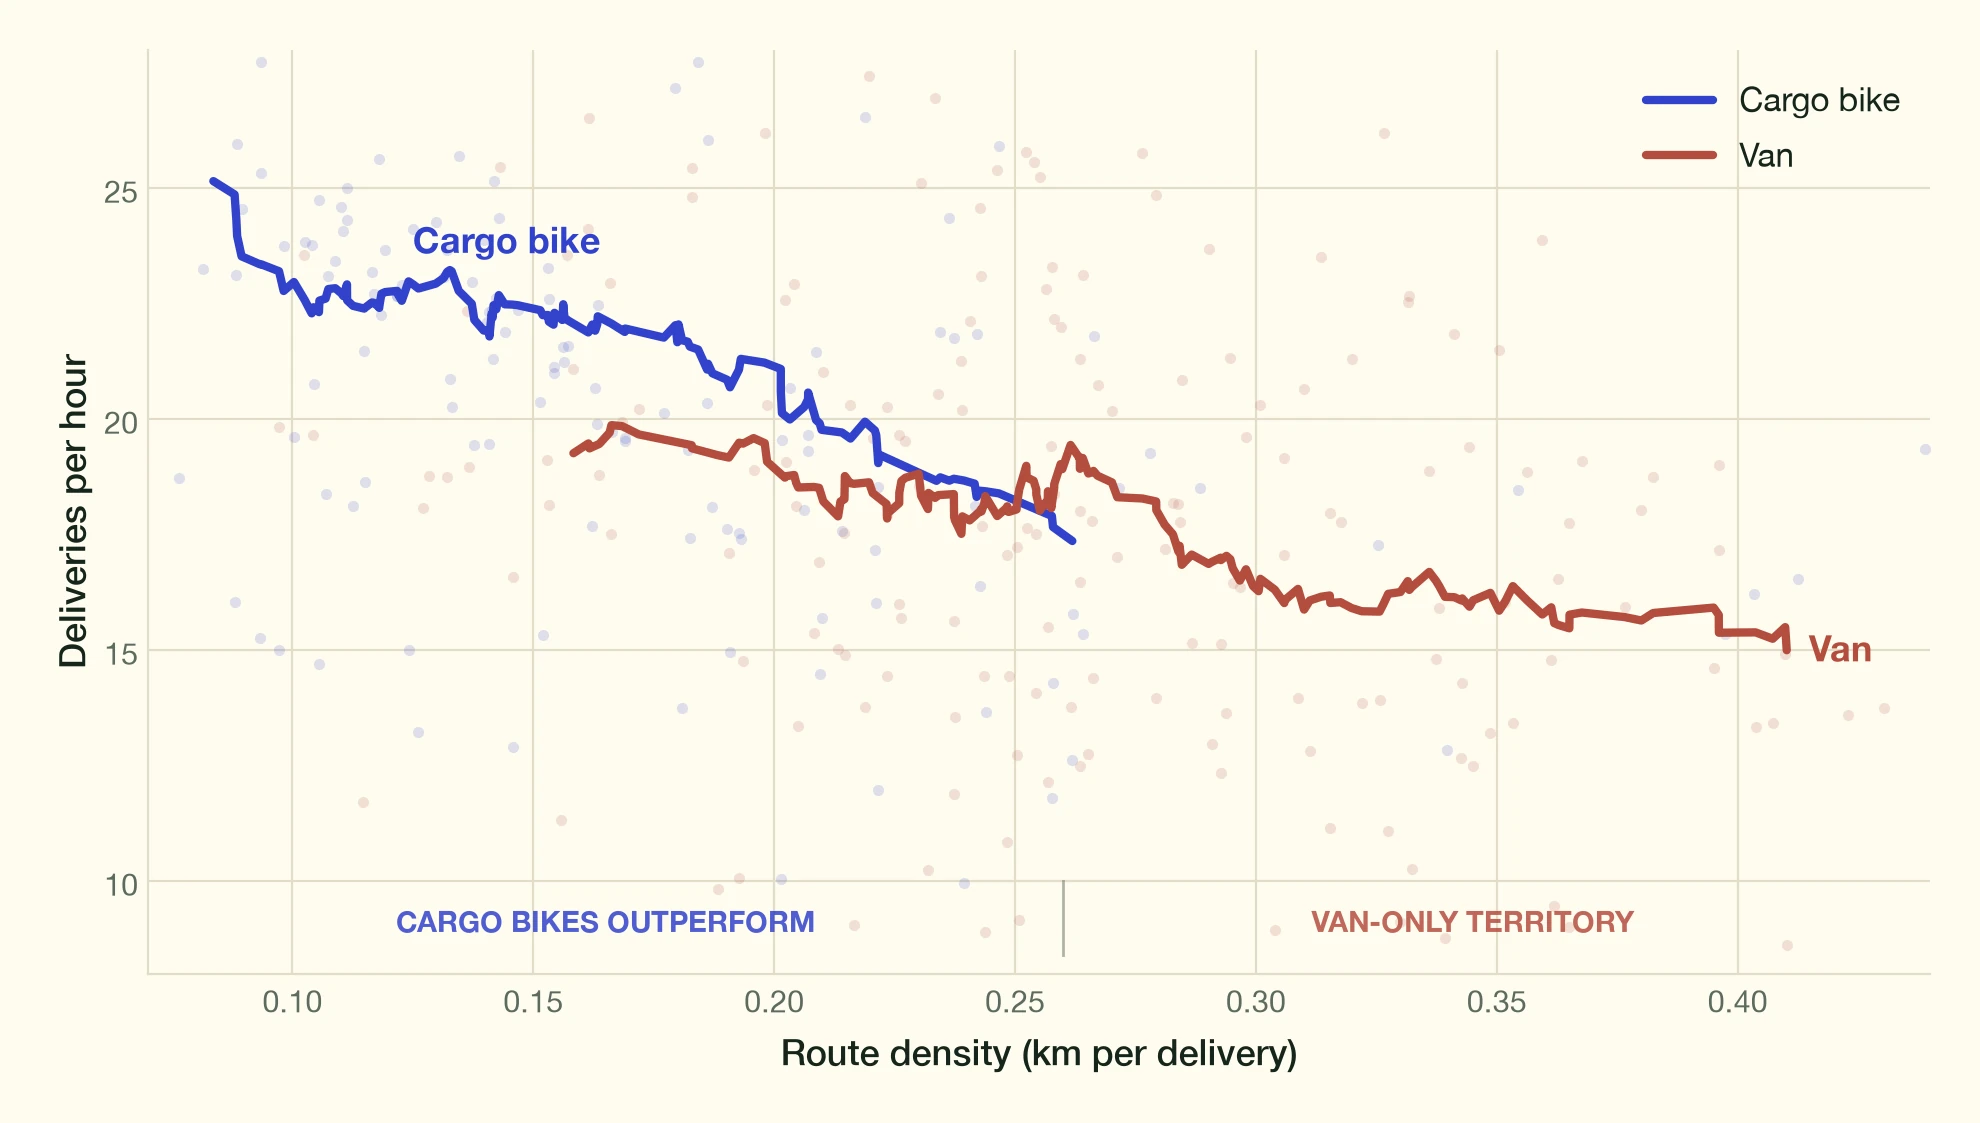
Intuitively, the closer deliveries are to each other, the more efficient one can be. However, denser delivery areas are associated with denser urban zones, and the reality of urban space means it can be more constraining for vehicles to find parking, easier to get stuck in congestion, and restricted access. This can lead to a lot of walking and worse performances.
Density Threshold and Vehicle Performance
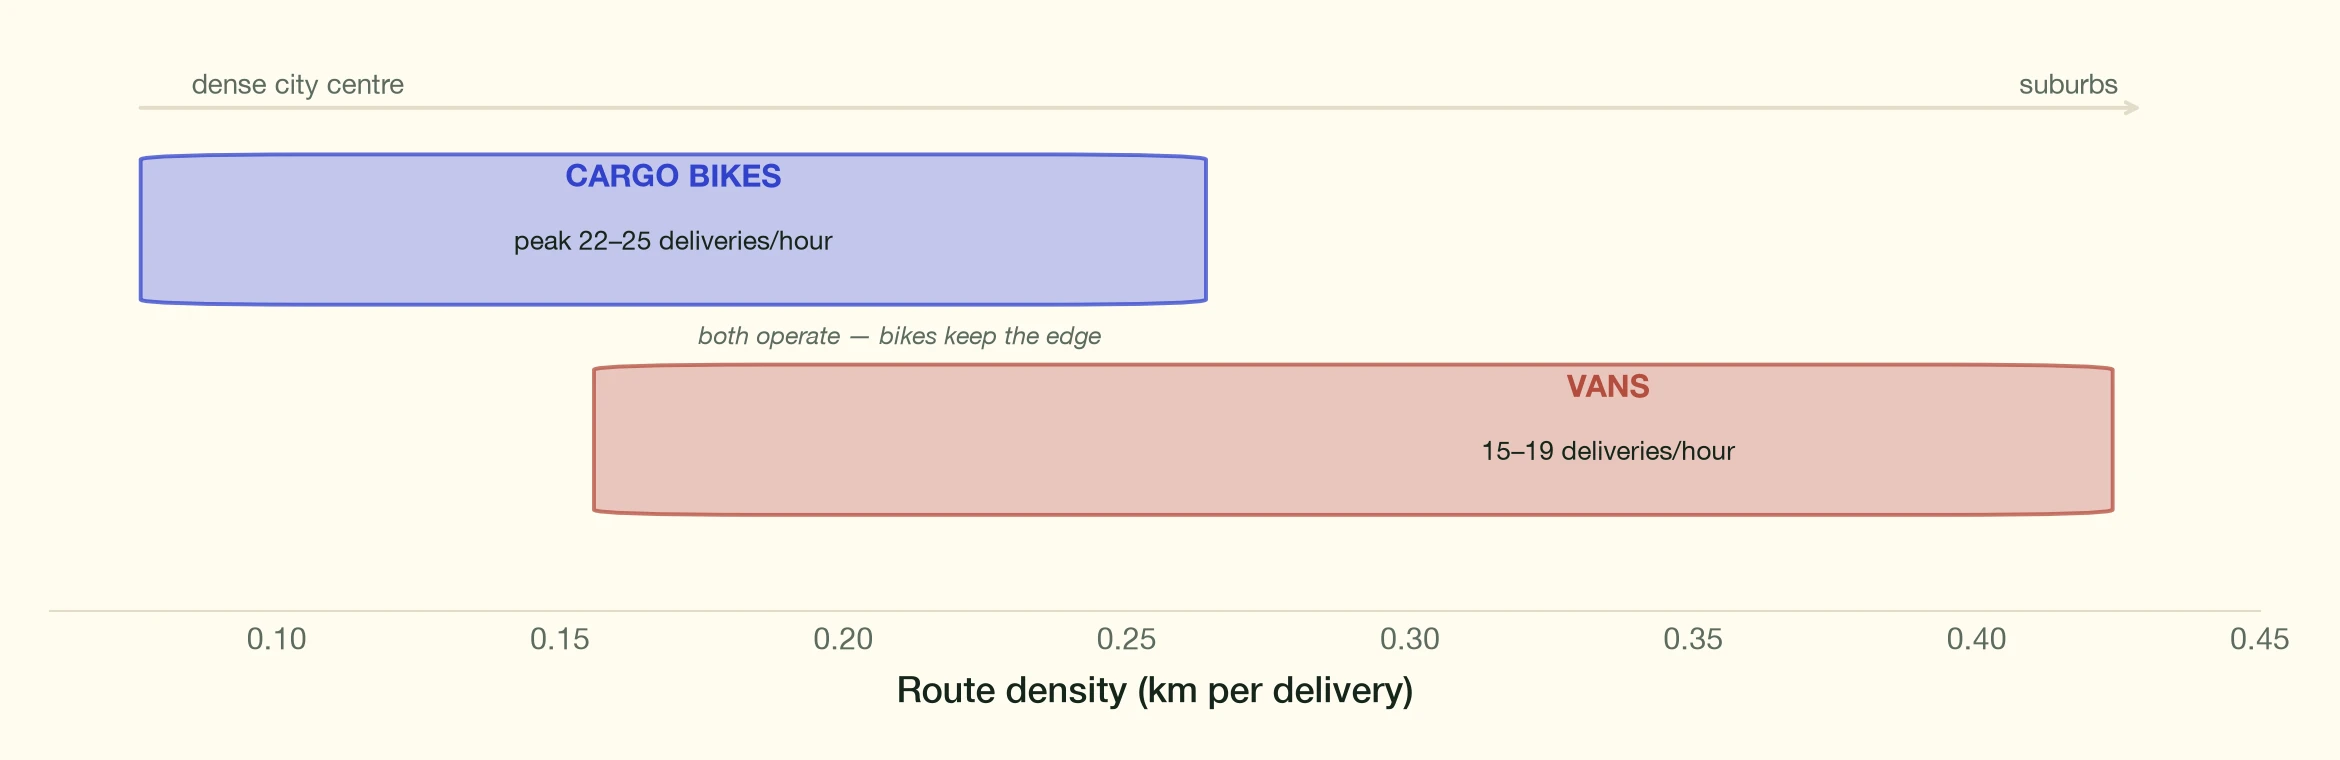
A striking pattern emerges in the data: KGS's cargo bikes consistently outperform vans in high-density scenarios, where the distance between deliveries is shorter. The efficiency gap between the two vehicle types widens as density increases (moving left on the graph, toward shorter distances between deliveries):
At 0.4 km per delivery, KGS vans achieve approximately 15 deliveries per hour; At 0.1 km per delivery, their cargo bikes reach around 25 deliveries per hour, while vans are notably absent from these high-density routes.
Operational Specialisation
The data reveals how KGS has naturally specialised its vehicle deployment across Brussels:
- Dominated by cargo bikes
- Performance peaks at 22-25 deliveries per hour
- Shows stable performance with tight confidence bounds
- Both vehicle types operate in this range
- Cargo bikes maintain a consistent efficiency advantage
- Represents a transition zone where KGS uses both vehicle types
- Primarily served by vans
- Efficiency gradually decreases with distance
- Wider confidence bounds suggest more variable performance
Complementary Roles
The absence of van data points in high-density zones (below 0.2 km per delivery) is particularly telling. This shows that KGS has made the strategic decision to shift away from van usage in these areas, having experienced their diminishing efficiency. The data supports KGS's operational model where:
Cargo bikes are preferentially deployed in dense urban cores like Ixelles and Etterbeek; Vans are used in less dense areas where their higher speed and capacity become advantages; A transition zone exists where both vehicles can operate effectively, allowing for flexible fleet management.
This analysis reinforces our earlier analysis about urban zone impacts on service times and suggests that KGS's optimal fleet composition should continue to be guided by the density characteristics of delivery areas rather than attempting to use a single vehicle type across all contexts.
3.3Key Findings
Our analysis reveals that cargo bikes and vans serve complementary roles in urban logistics. The data clearly shows that cargo bikes excel in dense urban environments, where their agility and parking advantages allow them to operate at a much higher efficiency than vans. As KGS dispatchers have reported, a single cargo bike can effectively replace almost two vans in the busiest urban areas, namely on the densest routes where KGS has stopped using vans altogether.
However, this is not a case of one vehicle type being universally superior. As density decreases and distances between deliveries increase, vans become increasingly efficient. Their larger capacity and ability to cover longer distances make them the optimal choice for suburban areas.
The economic implications of these findings are significant. When deployed in appropriate urban contexts, cargo bikes can substantially reduce operational costs through:
This evidence suggests that logistics operators should consider a mixed fleet approach, strategically deploying each vehicle type where it performs best. The key is matching the right tool to the right job - cargo bikes for dense urban cores, and vans for suburban and lower-density areas.
4Performance Robustness Analysis
4.1Geographical Conditions
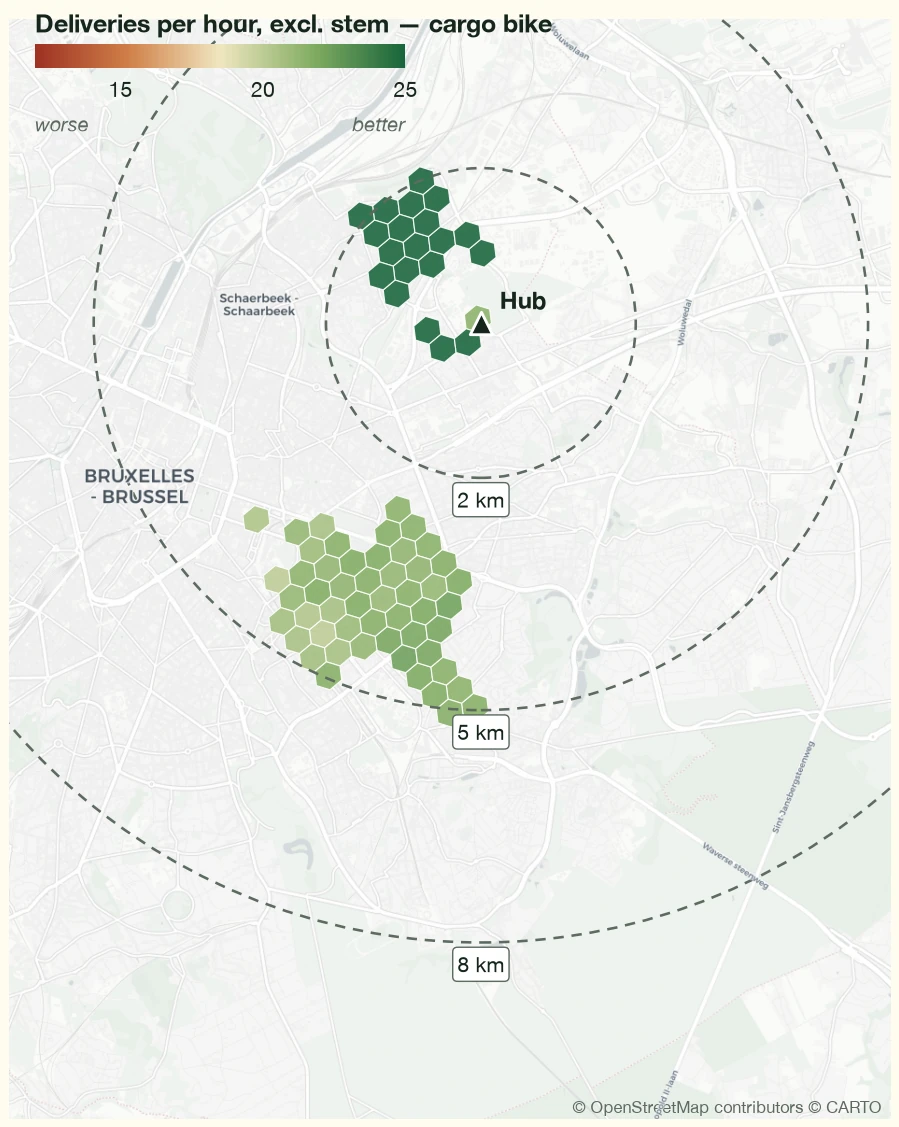
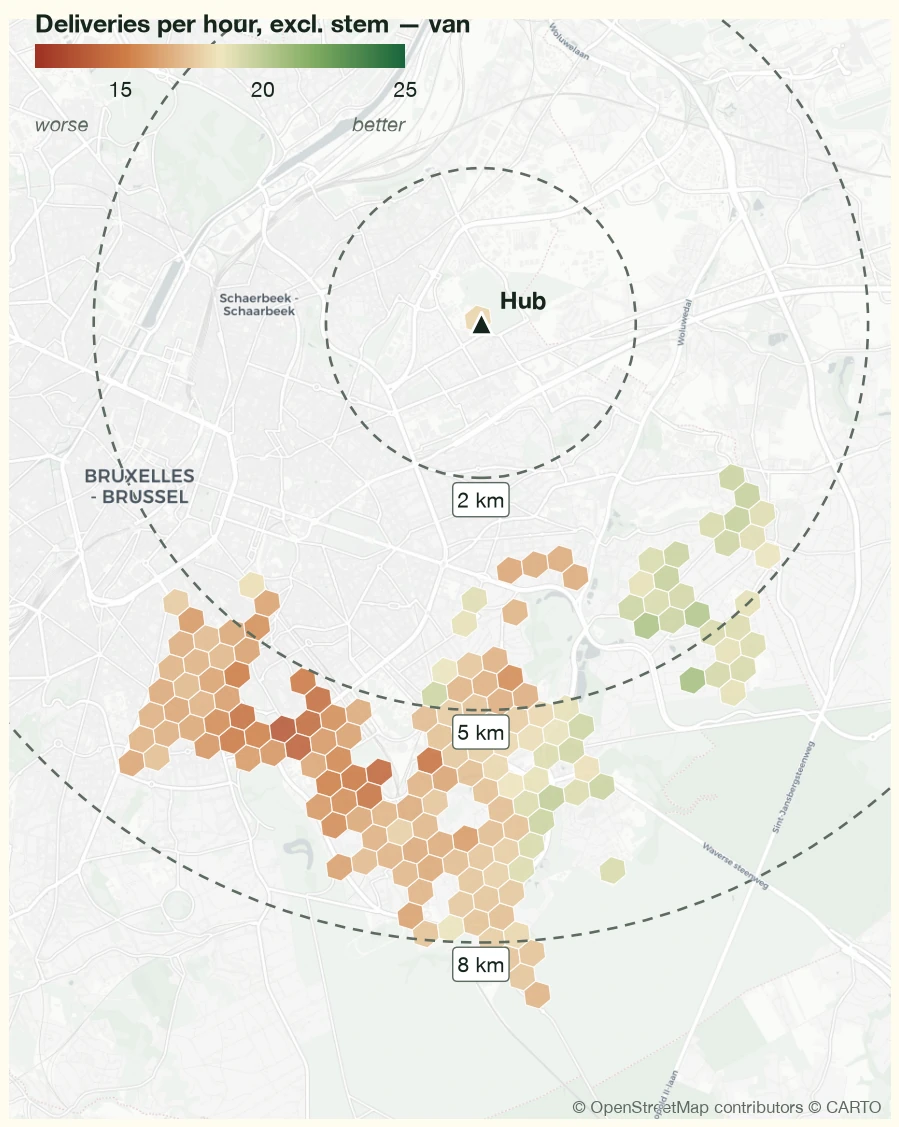
In this section we look at the performance of vehicles according to their geographic location. We do this by plotting a heat-map where each hexagon aggregates the historical performance of vehicles and shows the average delivery per hour. We exclude the stem time in this analysis, to only focus on the "operational" efficiency of vehicles, without considering the distance to the hub as a performance factor.
The heat maps visualise the performance across Brussels for both cargo bikes (Figure 14) and vans (Figure 15), revealing distinct patterns in vehicle performance across different urban zones. Our spatial analysis demonstrates how both urban context and delivery density significantly influence vehicle performance, with their relative importance varying between vehicle types.
Operational Cargo Bike Performance
The cargo bike heat map shows consistently high performance (green hexagons) across their operational area. This shows that cargo bikes maintain steady delivery rates of 20-25 deliveries per hour across most of their service area, with only slight variations in the southern regions (yellow hexagons) where delivery rates drop to around 15-18 deliveries per hour, and nearest to the pentagon. The high delivery efficiency in the North is particularly noteworthy - while this area has lower population density than the city centre, it maintains high performance due to the fact KGS has high levels of parcel delivery density in that area (see Appendix 8.4, showing the delivery density of the different areas). This demonstrates how operational efficiency is more closely tied to the density of deliveries than to general urban density for cargo bikes.
Operational Van Performance
The van heat map reveals a more varied performance pattern, with efficiency again being explained both by the urban area and the delivery density patterns. The central and southern areas, particularly around Ixelles and Saint-Gilles, areas that are known for their narrow streets, one-way streets, and lots of traffic, show significantly lower efficiency (orange-red hexagons) with delivery rates dropping to 12-15 deliveries per hour, despite high delivery density. Performance improves in the more peripheral areas (yellow-green hexagons), where vans achieve 18-20 deliveries per hour. This pattern suggests that while delivery density is crucial for efficiency, its benefits for vans are often offset by urban constraints in dense areas.
4.2Hub Proximity Effects
While the previous analysis excluded stem time to focus on operational efficiency, understanding the impact of hub location is crucial for real-world operations.
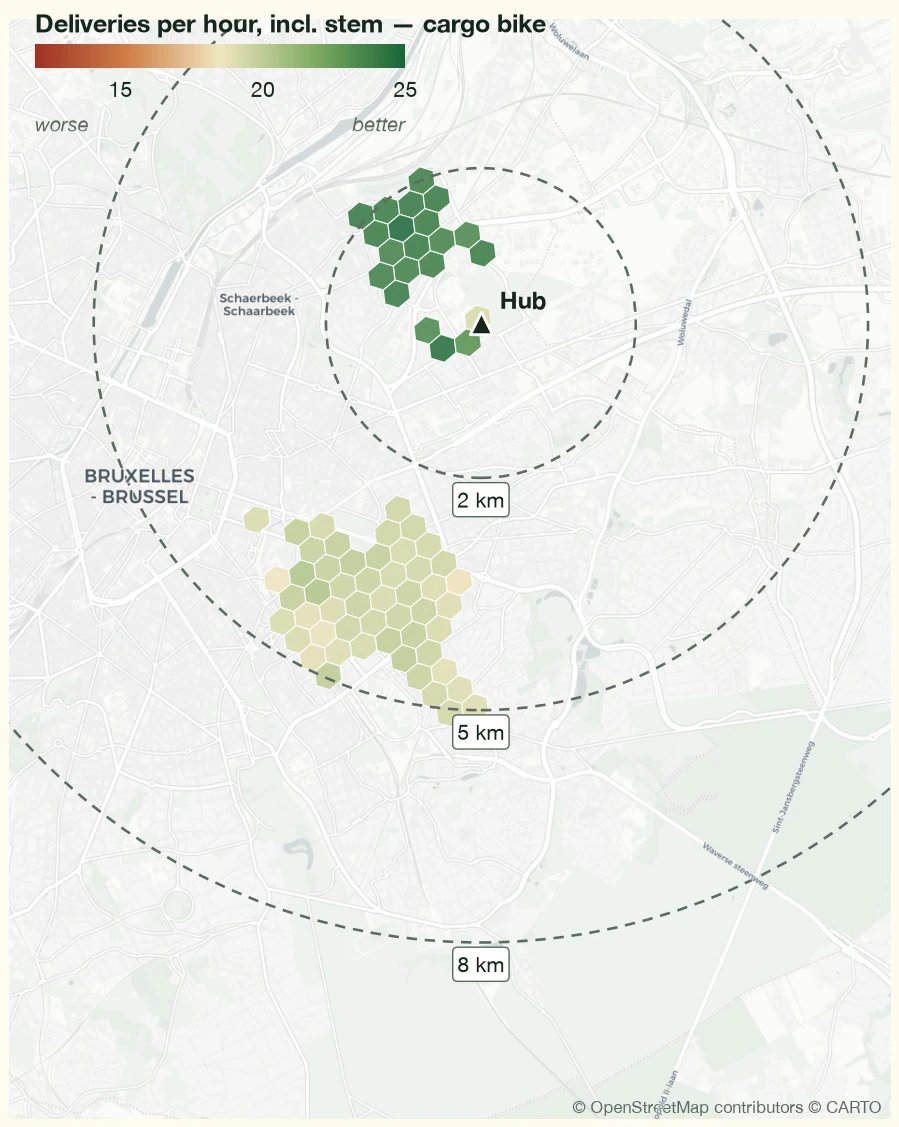
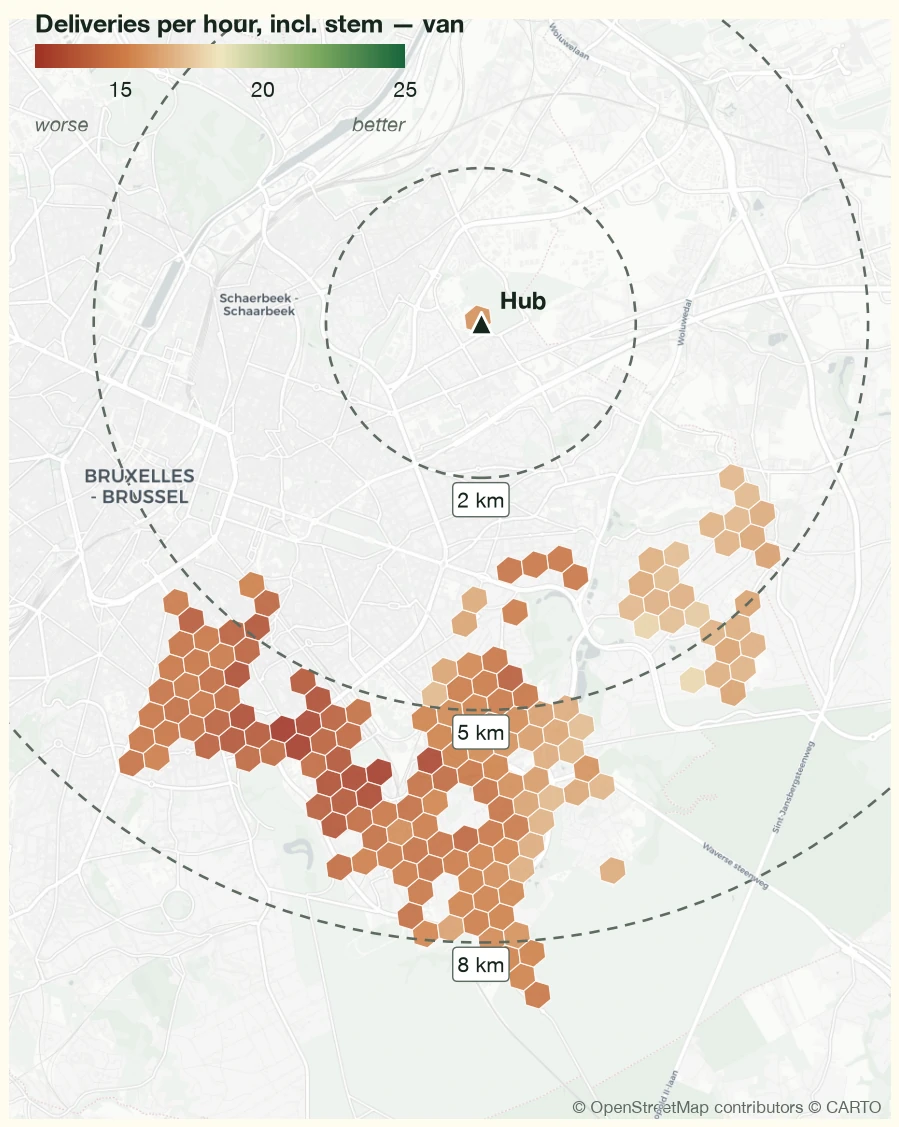
When including stem time, the data reveals how depot location affects overall route performance.
Cargo Bike Stem Distance Impact
A clear efficiency gradient emerges radiating from the hub:
Van Performance Under Stem Constraints
Central areas of Ixelles and Saint-Gilles drop to 12 deliveries per hour or less; Previously efficient peripheral areas show reduced performance; The efficiency penalty appears more severe for vans than cargo bikes.
Vans show an even more dramatic deterioration when stem distance is considered. Central areas that were already challenging show notably poor performance (12 deliveries per hour or less), and even previously efficient peripheral areas demonstrate reduced performance when stem distance is included. This efficiency penalty appears more severe for vans than for cargo bikes, partly because their base operational efficiency was already lower in urban areas.
This analysis demonstrates how hub positioning can significantly impact operational efficiency, suggesting the potential value of strategically placed micro-hubs to optimise performance.
4.3Cross-City Performance Analysis
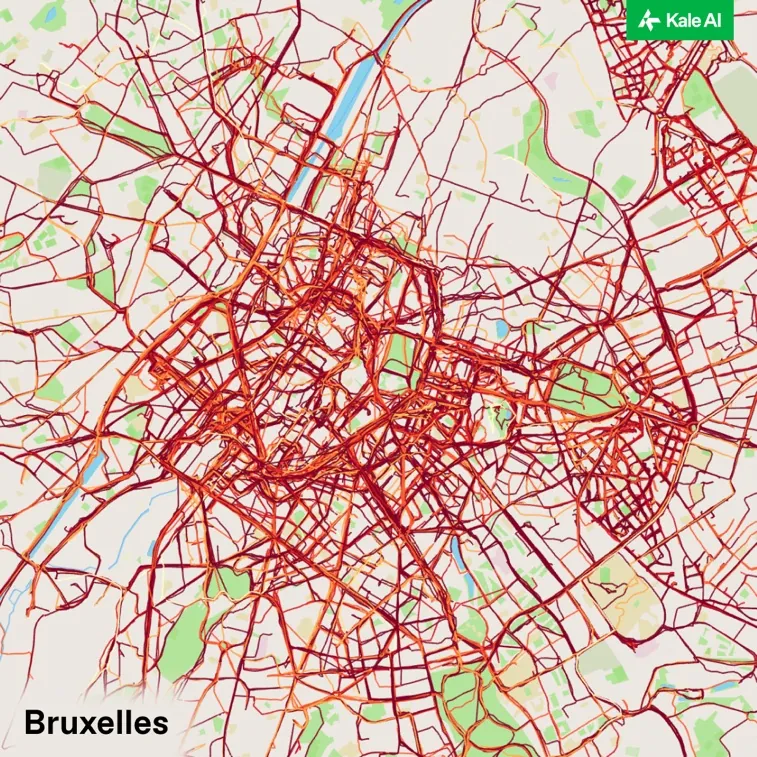
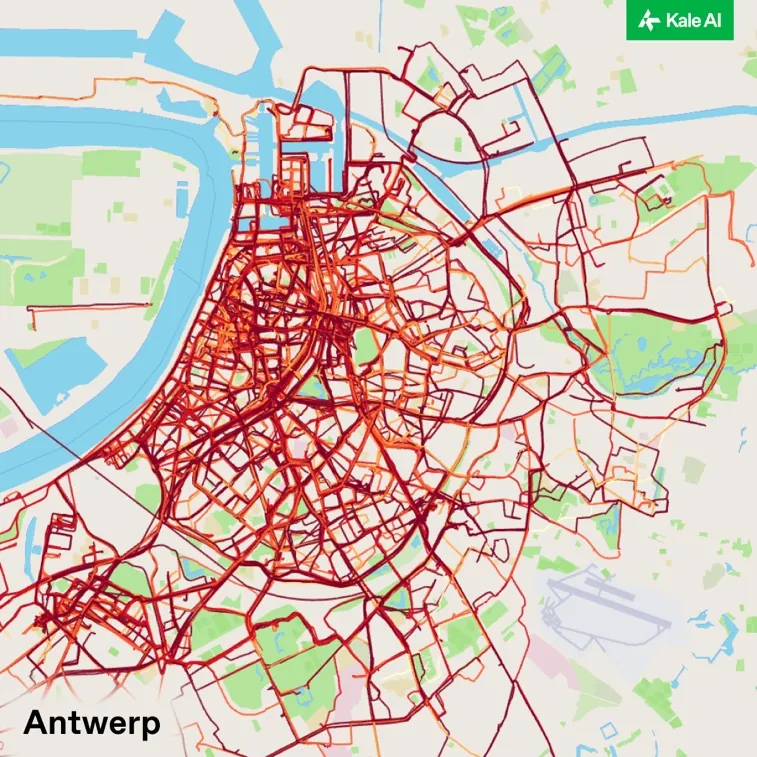
To further investigate the robustness of cargo bike performance across different urban contexts, we analysed GPS traces from 6 operators across four Belgian cities: Brussels, Ghent, Liège, and Antwerp. Our analysis aimed to test the hypothesis that cargo bikes maintain consistent performance across varying urban environments, unlike vans which show significant performance degradation in dense urban areas.
Methodology
Collected GPS traces from cargo bike operators across multiple cities; Applied the same urban zone classification methodology used in our Brussels analysis; Two operators (Cargo Velo and Urbike) provided data from multiple cities, enabling direct city-to-city comparisons; We analysed moving speeds while excluding stopping time to focus on pure mobility performance.
Key Findings
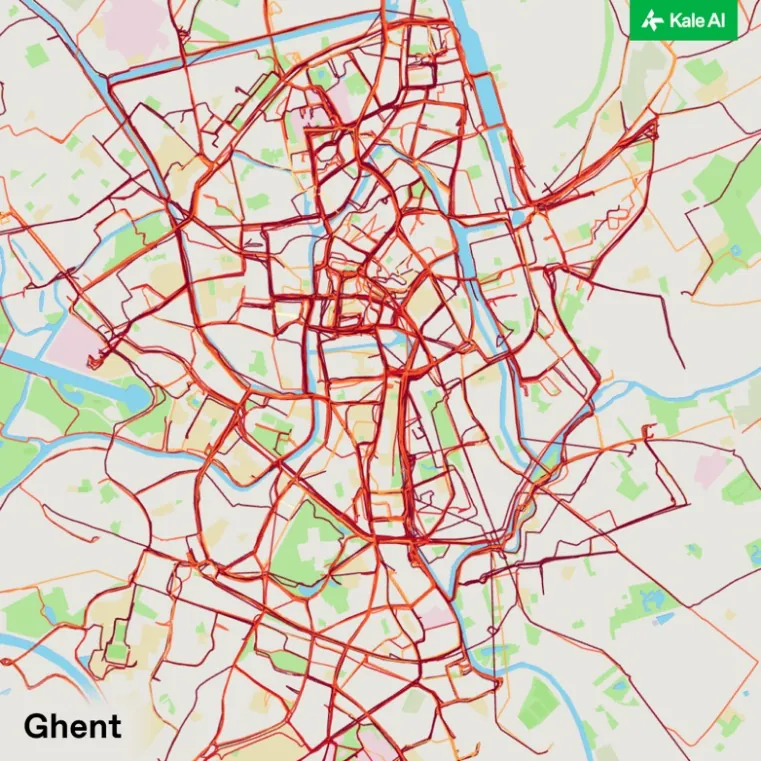
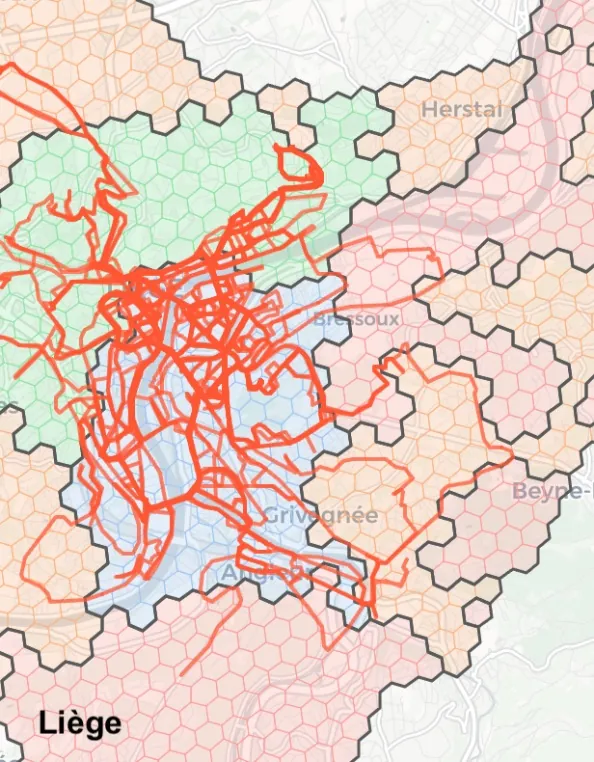
Within each city, cargo bikes showed remarkable consistency across urban zones, with minimal variation between dense centres and less dense areas.
The superior performance in Ghent likely reflects the city's comprehensive sustainable mobility policy, which has successfully:
Reduced motorised traffic, high-quality cycling infrastructure, and traffic-calmed zones with restricted access areas.
The similar performance levels between Brussels and Liège, despite their different cycling infrastructure development stages, suggests that cargo bikes can maintain efficient operations even in cities with less developed cycling infrastructure. This finding reinforces our hypothesis about the resilience of cargo bike performance across different urban contexts.
This cross-city analysis provides strong evidence that cargo bikes can maintain consistent performance regardless of urban density - a crucial advantage over vans, which we found to be significantly impacted by urban context in our Brussels analysis. The data suggests that while supportive infrastructure can enhance cargo bike performance (as seen in Ghent), these vehicles can operate effectively even in cities with varying levels of cycling support.
4.4Temporal Conditions
This section examines how delivery service times vary throughout the day, comparing the performance of cargo bikes and vans across different time periods.
Service time analysis reveals distinct patterns across different urban zones, with the most pronounced effects observed in Core Area (central Brussels). In Core Area, cargo bikes demonstrate remarkable consistency, maintaining service times between 2-3 minutes per delivery throughout the day with relatively stable variance. In contrast, van performance shows both deteriorating averages and increasing unpredictability during peak hours.
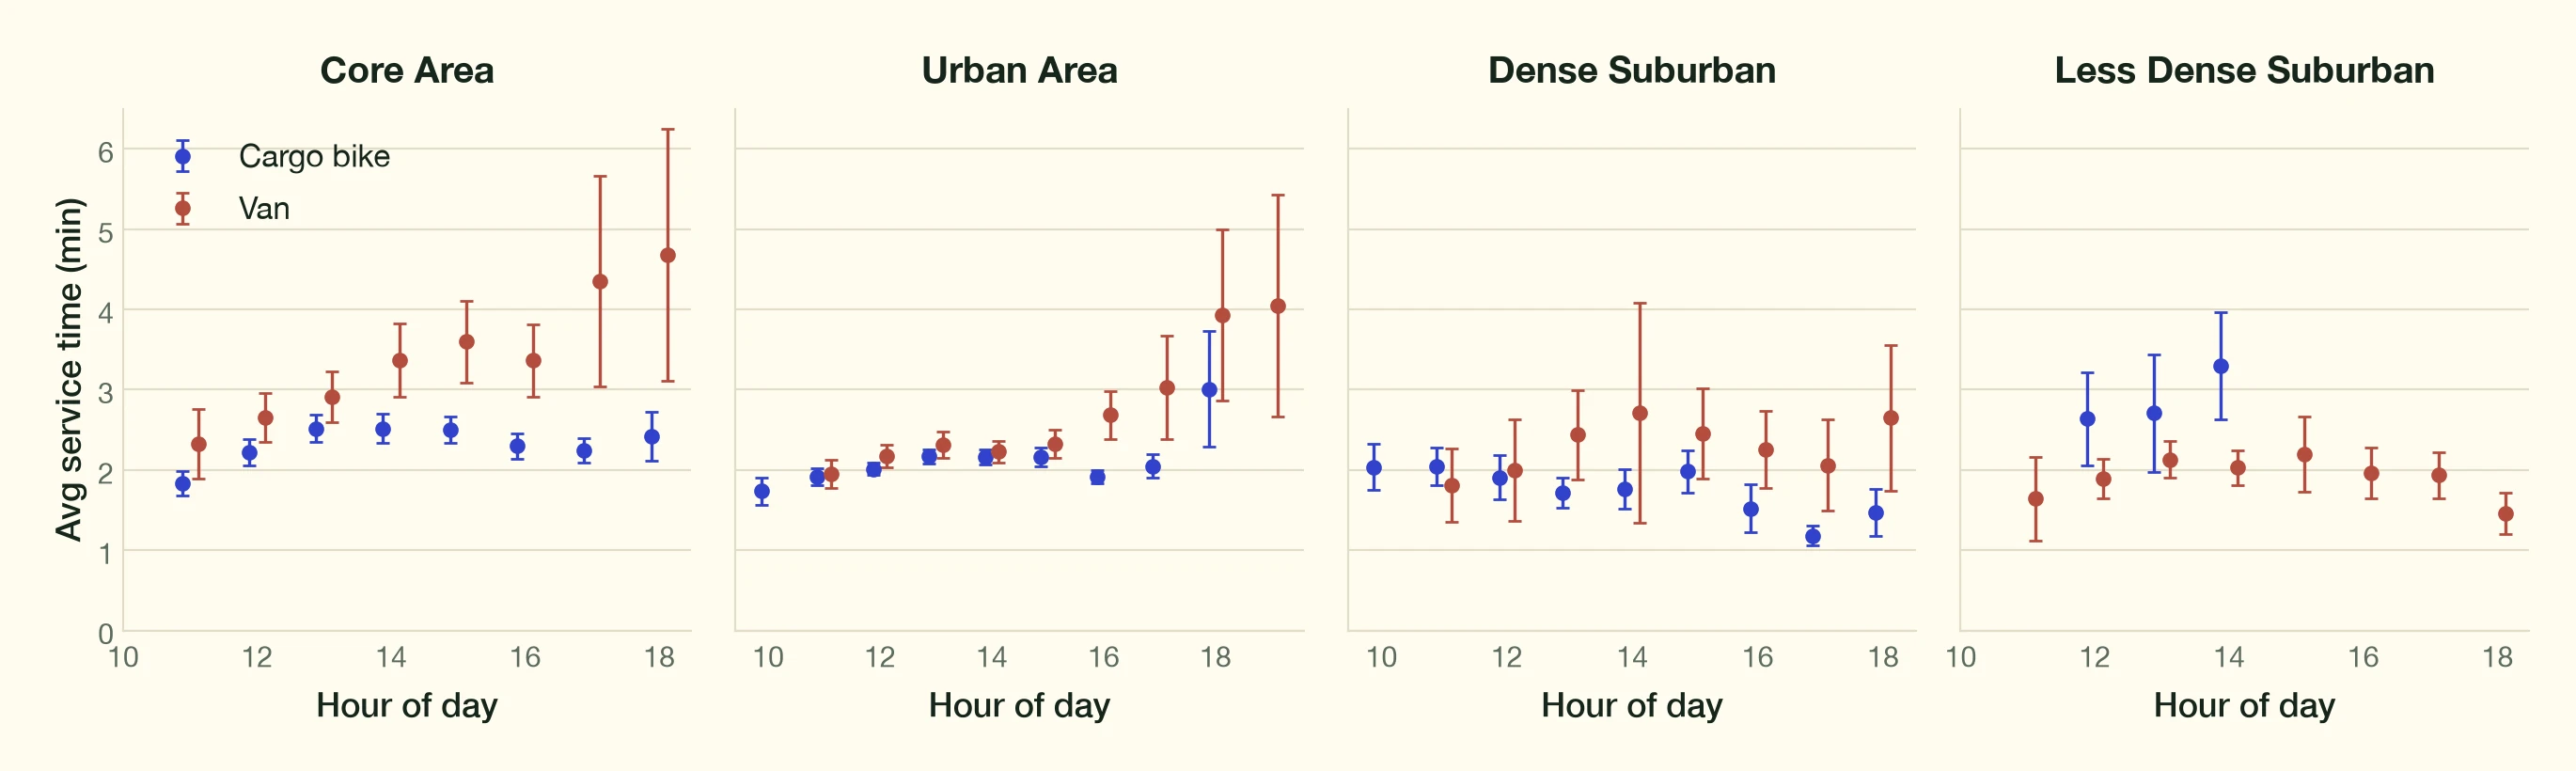
Van service times increase from approximately 3 minutes per delivery at 14:00 to nearly 6 minutes by 18:00, with the variance in service times growing substantially during these peak hours. This means that not only do deliveries take longer on average, but they also become significantly less predictable, making route planning, and scheduling more challenging.
Outside Core Area both vehicle types show more consistent service times throughout the day:
Urban Area exhibits slight afternoon increases but much less pronounced than Core Area; Dense Suburban and Less Dense Suburban areas maintain relatively stable service times for both vehicle types; The performance gap between vans and cargo bikes is notably smaller outside of Core Area.
This temporal analysis reinforces our earlier findings about the challenges vans face in dense urban environments, particularly during peak hours. The stability of cargo bike service times across all time periods suggests they are less susceptible to temporal factors that typically affect van deliveries, such as rush hour traffic and competition for parking spaces.
5Broader Applications
The study of KGS GROUP data has enabled us to demonstrate that cargo bikes stand out from vans in last-mile delivery operations because of their flexibility (particularly when it comes to parking at the destination), their speed of movement in dense areas, and their robustness in the face of urban constraints. These qualities make them a particularly effective solution for the distribution of e-commerce parcels, since this is a flow traditionally made up of small parcels that can offer (very) high delivery density. But it is also a relevant solution for other types of logistics flows, such as B2B parcel deliveries and shuttle services.
5.1B2C Parcel Deliveries
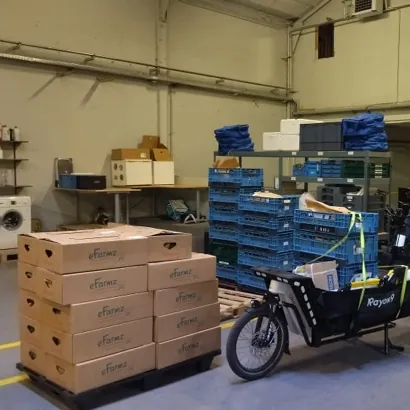
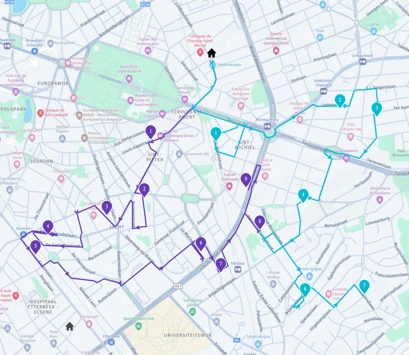
B2C deliveries (business-to-customer) bring parcels to private individuals. It is the segment where cycle logistics has most clearly demonstrated its potential, as the KGS results in this report show.
Load volume — 30–60 parcels per round for standard e-commerce; 10–20 for specialised flows such as food
Hub location — within 5–6 km of the delivery area to keep rounds efficient
Time slots — morning and evening customer windows; premium flows (catering, flowers) may impose fixed delivery sequences
Delivery rate — a steady 15–20 deliveries per hour in dense areas; 5–10 where service requirements are higher
5.2B2B Parcel Deliveries
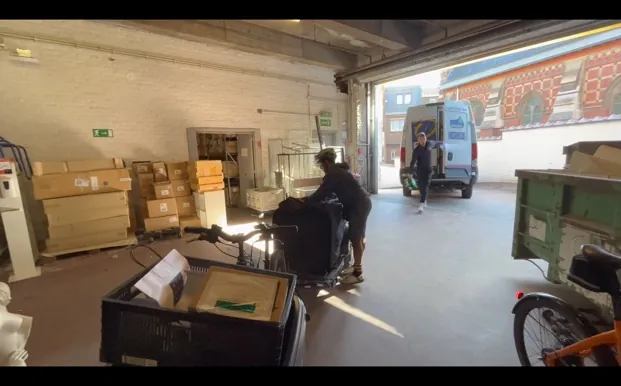
B2B flows (business-to-business) deliver goods between companies — supplying shops, restaurants and offices, or distributing specialised products: goods for sale, technical equipment, supplies, raw materials, press.
Equipment — compartments suited to the goods, e.g. refrigerated boxes for fresh produce
Hub location — close to an urban warehouse — the empty run before the first drop directly limits parcels per round for bulky goods
Flow integration — frequent small-volume flows demand responsiveness and interoperability with client systems
Schedules — strict windows before or after retail opening hours
5.3Shuttle Service
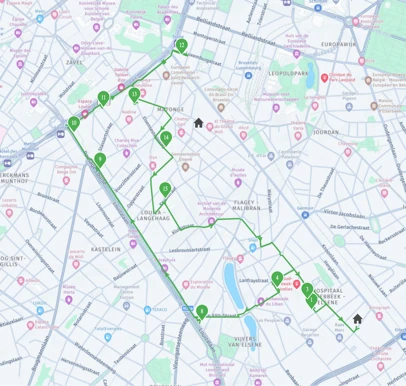
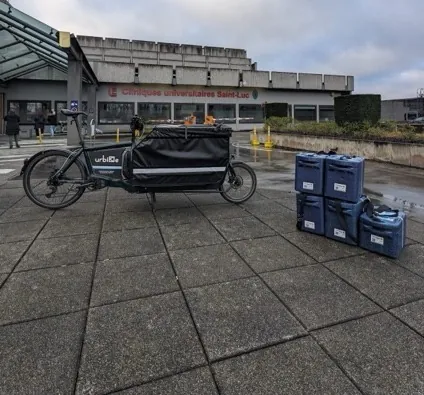
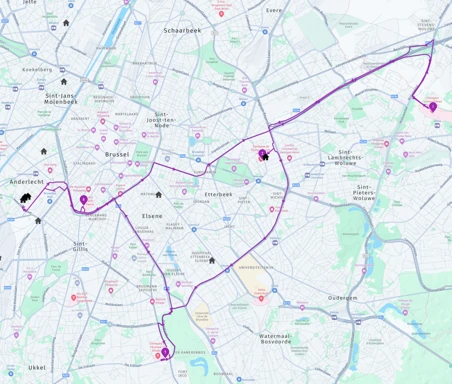
Shuttle services move goods or documents between two fixed points: a depot and a relay point, or two sites of the same organisation — clinics and analysis laboratories, hotels, production workshops and their shops or restaurants.
Route fit — legs stay within 5–10 km and avoid remote endpoints, where the bike loses its edge
Equipment — validated once for the homogeneous flow — bulky, repeated or temperature-controlled loads
Punctuality at frequency — average speeds of 20–22 km/h in Ghent and 17–19 km/h in Brussels and Liège keep short rotations reliable
Direct access — bikes take direct routes unaffected by congestion, so collection and delivery times stay predictable
5.4Conclusion
The performance of cargo bikes demonstrates their compatibility with a wide variety of logistics flows. Their speed, robustness and flexibility make them an effective alternative or complement to motorised vehicles, whether for deliveries to private customers (B2C), inter-company supplies (B2B) or repetitive shuttle services.
High order volumes and fast, detailed coverage of residential areas.
Punctuality, flexibility, and medium-to-large volumes on schedule.
Regular, homogeneous flows between fixed points at a sustained, predictable pace.
These advantages make cycle logistics an ideal solution for today's urban challenges, such as reducing emissions and optimising logistics chains in urban environments.
6Environmental and Social Impact
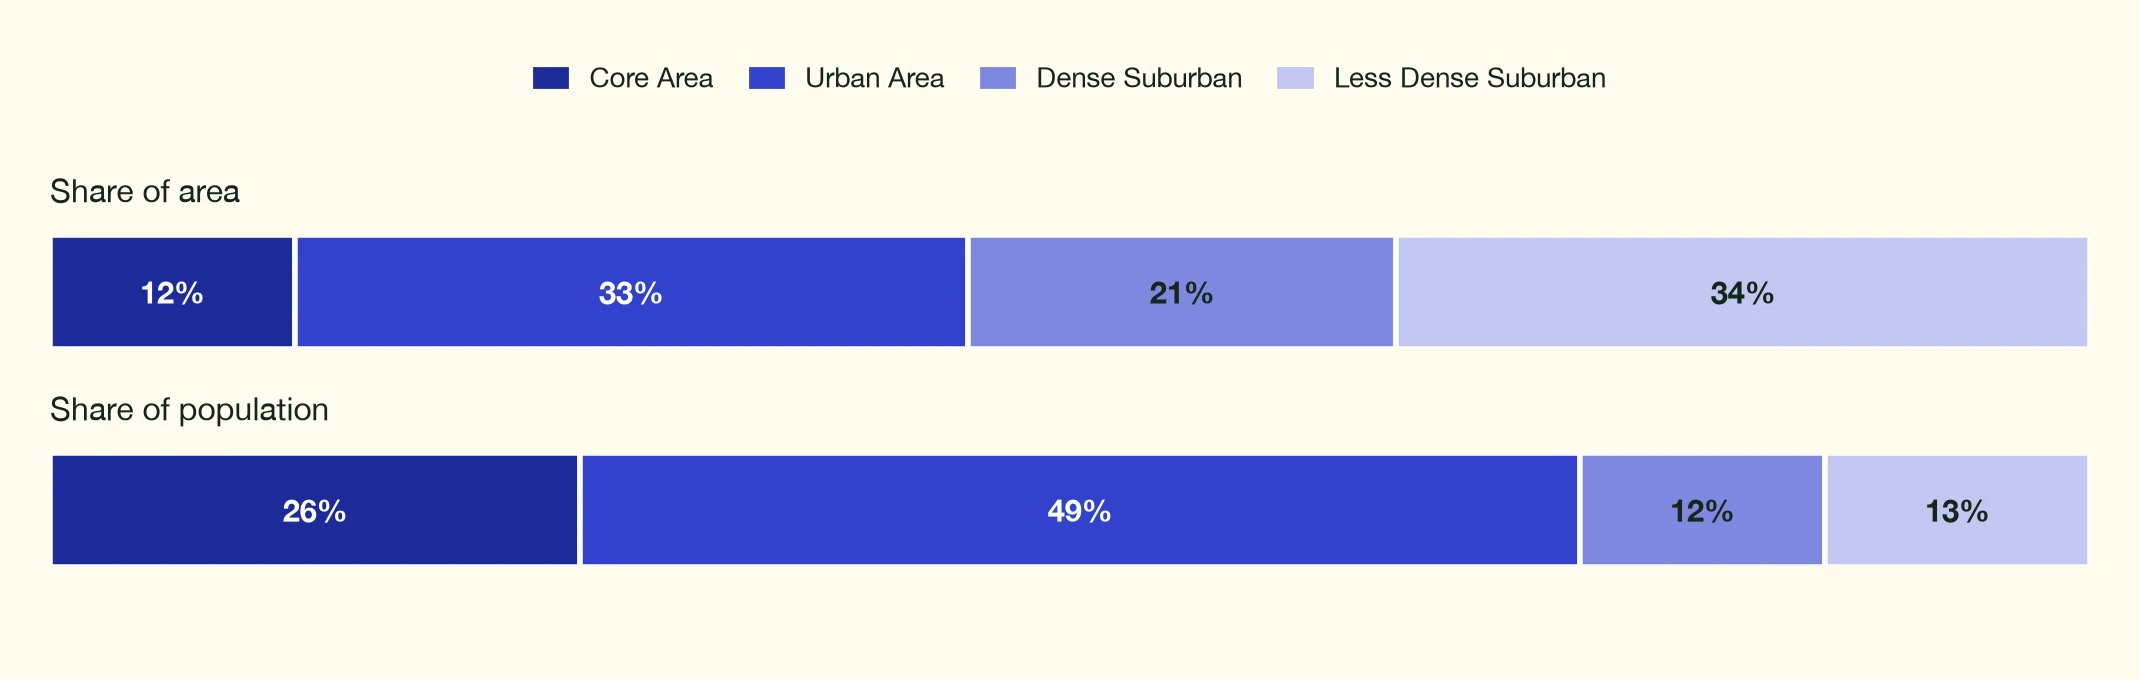
The impact of transitioning to cargo-bikes and Light Electric Vehicles in urban environments extends far beyond operational efficiency. Using High Resolution Population Density Maps (Meta & Columbia University, 2022)10, our analysis of Brussels reveals a compelling opportunity: while the city centre comprises only 12% of the total area, it houses 26% of the population (326,000 people). When including the wider dense urban area, 75% of the population (950,000 people) lives in zones optimal for cargo-bike operations. This concentration means that targeted transitions in dense urban areas can achieve disproportionate positive impacts on residents' daily lives.
6.1Environmental Impact
The environmental advantages of cargo-bikes manifest across multiple dimensions. Lifecycle assessment of Urbike's operations in Brussels, covering both vehicle-cycle and well-to-wheel emissions, demonstrates that cargo-bikes emit just 8 gCO2e/km, compared to 320 gCO2e/km for diesel vans and 160 gCO2e/km for electric vans - representing reductions of 98% and 95%, respectively7.
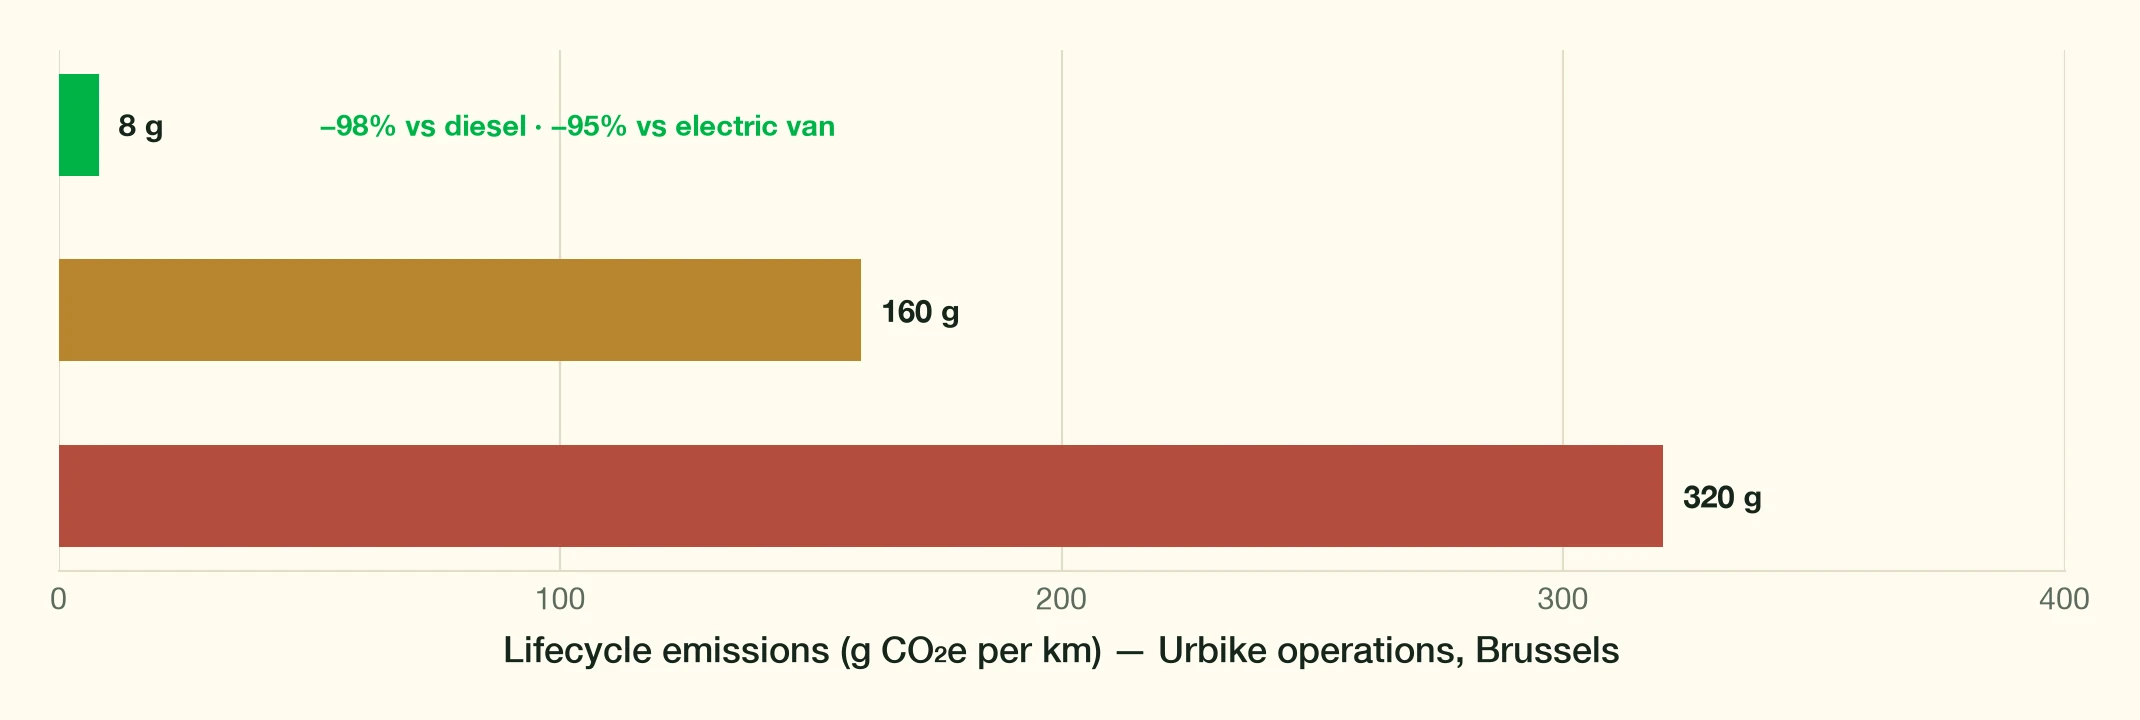
These dramatic emissions reductions are amplified by the complete elimination of noise pollution, a particularly significant benefit in Brussels' historic core where narrow streets and dense building patterns typically amplify traffic noise.
The true environmental impact becomes even clearer when considering hidden ecological costs. Traditional delivery vehicles impose substantial environmental burdens throughout their lifecycle, and these impacts are especially acute in dense urban areas where pollutants become trapped, and noise reverberates between buildings. When all environmental externalities are accounted for, traditional van deliveries impose several times more ecological burden than cargo-bike alternatives.
6.2Urban Space and Mobility
The spatial and mobility advantages of cargo-bikes are particularly pronounced in dense urban environments. While a standard van requires approximately 12 square meters of parking space, cargo-bikes need significantly less area and can access zones restricted to motor vehicles. This space efficiency proves invaluable in Brussels' core zones, where competition for street space is intense, and vehicle access is often restricted.
Beyond static space utilization, cargo-bikes demonstrate superior mobility in congested conditions. Analysis of operational data shows that cargo-bikes maintain consistent delivery performance across various urban contexts by utilizing bike lanes and alternative paths. In Brussels' core zones, where narrow streets and high activity density create significant congestion, cargo-bikes maintain steady performance while van delivery times can more than double during peak periods.
6.3Safety and Infrastructure
Safety data reveals a stark contrast between delivery modes. In London, vans and HGVs were involved in 32% of fatal collisions between 2015 and 2017. Cargo-bikes, with their lower operating speeds (maximum 25 km/h) and better manoeuvrability, present significantly lower safety risks. The social costs of traditional deliveries extend beyond accidents to include road maintenance burden due to vehicle weight, congestion due to size, and health impacts on drivers from prolonged sedentary behaviour and pollution exposure.
However, realizing the full potential of cargo-bikes requires appropriate infrastructure investment. This includes protected bike lanes, secure parking facilities, and strategic consolidation hubs. Such investments become particularly compelling when considering that a relatively modest geographical transition (12% of city area) can benefit over a quarter of the population in dense urban cores.
The comprehensive impact analysis demonstrates that cargo-bikes offer advantages that extend far beyond immediate operational benefits. When all environmental, spatial, and social factors are considered, they represent a transformative opportunity for urban logistics, particularly in dense city centres where their benefits are amplified. The concentration of population in areas most suitable for cargo-bike operations suggests that targeted transitions could achieve rapid and significant positive impacts on urban life quality and environmental sustainability.
7Conclusions and Recommendations
7.1Key Insights Summary
Our analysis examines KGS Group's delivery operations in Brussels two years after their successful integration of cargo bikes into their fleet. This established operation provided an ideal study environment, as the company had already optimized their vehicle deployment based on extensive operational experience.
The distinct routing patterns that emerged - with cargo bikes and vans serving different areas based on their comparative advantages - offered a unique opportunity to analyse vehicle performance while also revealing how operators have discovered and refined optimal use cases for each vehicle type.
The study focused primarily on service times and delivery efficiency, as these metrics proved most critical for urban delivery performance. Service time - the duration spent at delivery points - is particularly significant, accounting for approximately 60% of a delivery day, and even more when excluding stem journeys to and from the hub. While our data did not allow for comprehensive analysis of route characteristics or moving speeds, the rich service time data provided valuable insights into real-world performance differences between vehicles.
Our analysis validates significant performance advantages for cargo bikes, particularly in dense urban environments, while also highlighting the complementary roles these vehicles can play in an optimized delivery network. The most striking finding is their superior delivery efficiency, achieving a median of 18.85 deliveries per hour compared to 14.77 for vans. While cargo bikes demonstrated greater variability in their performance range (from 12 to over 30 deliveries per hour), their potential peak efficiency substantially exceeded vans, which rarely surpassed 25 deliveries per hour.
This advantage was particularly evident in route density, where cargo bikes operated effectively at much higher densities (2-10 deliveries per km, median 4.27) compared to vans (1-4 deliveries per km, median 2.04).
The performance differential was most pronounced in central Brussels, where cargo bikes averaged 30% faster service time per delivery than vans, amounting to approximately 1.5 hours saved per 100-delivery route. Notably, cargo bikes maintained consistent performance across dense urban areas, even in locations where van performance deteriorated significantly.
In the five most challenging areas of the city (each hexagon covering approximately 0.7 km²), the contrast was the strongest - cargo bikes maintained reasonable average service times of 2.4 minutes while vans struggled with averages of 4.2 minutes, representing a 75% difference in service time. This efficiency gap was most evident in outlier cases, with 95th percentile service times for cargo bikes peaking at 5.8 minutes in these challenging areas, while vans could take up to 14.5 minutes, i.e. 2.5x longer, and a difference of 8.7 minutes per problematic delivery.
This demonstrates how van deliveries can become extraordinarily time-consuming in challenging urban environments, while cargo bikes maintain relatively consistent performance even under difficult conditions.
The resilience of cargo-bikes across urban conditions was confirmed when studying deliveries during peak hours in the centre. Here, van delivery times doubled from 3 to nearly 6 minutes per delivery between 14:00-18:00, while cargo bikes maintained consistent 2-3 minute delivery times throughout the day.
However, the data also reveals clear patterns for optimal deployment. Cargo bikes excel in high-density scenarios (0.1-0.2 km between deliveries), maintaining peak efficiency of 22-25 deliveries per hour with remarkable consistency. Vans, while facing challenges in central zones, demonstrate better suitability for lower-density peripheral routes.
This natural differentiation suggests an optimal deployment strategy where each vehicle type serves its most efficient territory.
Implementation considerations emerge from these findings. The impact of hub location proved more significant than anticipated, with stem distance affecting van efficiency more severely than cargo bikes. This creates natural boundaries for vehicle deployment and suggests the strategic importance of hub placement in maximizing fleet efficiency. The clear transition zone between optimal cargo bike and van territories provides a practical guide for fleet managers in vehicle allocation decisions.
These insights point toward a hybrid delivery model where cargo bikes serve dense urban cores while vans handle peripheral routes, maximising the strengths of each vehicle type. The surprisingly consistent performance of cargo bikes across their operational area, combined with their superior efficiency in challenging urban environments, suggests significant potential for expanded deployment in city centres.
However, successful implementation will require careful consideration of hub locations, route density patterns, and the distinct operational characteristics of each vehicle type.
7.2Implications and Strategic Recommendations for Urban Logistics
The analysis of mixed fleet operations in Brussels offers valuable insights for the urban logistics sector as a whole. The clear superiority of cargo bikes in dense urban areas, achieving significantly higher delivery rates and much lower service times, suggests substantial opportunities for both operational efficiency and cost reduction across the industry. However, these advantages must be balanced against the practical constraints of cargo bike operations, including limited range from hubs and cargo capacity.
The data supports a nuanced approach to fleet optimisation with several key strategic implications:
First, the logistics sector should reconsider its traditional hub-and-spoke model for dense urban areas. The strong performance of cargo bikes within their operational radius, combined with their sensitivity to stem distance, suggests that a micro-hub network could extend efficiency advantages across urban areas. These hubs should be strategically positioned at the periphery of high-density zones to maximise the service area while minimising real estate costs - a model that challenges the current practice of large, peripheral distribution centres.
Second, the industry needs to develop more sophisticated vehicle allocation strategies based on detailed urban characteristics. The clear efficiency gradients observed in both vehicle types indicate that operators could benefit from more granular zone-based deployment rules. Traditional van fleets remain optimal for lower-density peripheral routes where their speed and capacity advantages outweigh their urban mobility challenges, while cargo bikes demonstrate clear advantages in high-density central zones. This suggests that the future of urban logistics lies in mixed fleet operations rather than a wholesale transition to any single vehicle type.
Third, route optimisation needs to explicitly account for urban context. The significant variation in service times across different urban zones suggests that routing algorithms should incorporate factors beyond simple distance and delivery count. This could include specific weightings for urban density, parking availability, and pedestrian zone access - factors that are often overlooked in traditional logistics planning.
These operational improvements could yield multiple benefits: reduced delivery costs through higher delivery rates, improved environmental performance through increased cargo bike usage, and enhanced service reliability through more consistent delivery times. The environmental impact is particularly noteworthy given increasing regulatory pressure for sustainable urban logistics and growing municipal restrictions on traditional vehicle access.
Looking forward, logistics operators should consider piloting these changes in phases, starting with areas showing the clearest potential for improvement. The sector would benefit from standardised performance monitoring and data sharing to enable continued optimisation of vehicle deployment strategies. This data-driven approach to fleet management could help the industry adapt to evolving urban mobility requirements while supporting broader sustainability goals in cities worldwide.
7.3Future Opportunities
Scaling potential
The future of cargo bike deliveries in cities is filled with significant opportunities. With cargo bikes capable of handling 33% of all professional urban transport—split between 25% for goods and 50% for services—the potential for growth is immense. Currently, cargo bikes account for only 1% to 1.5% of urban deliveries, but adoption is accelerating. In 2023, according to the BCLF’s Barometer 2024 of Cycle Logistics11, the number of parcels delivered by cargo bike reached 3.1 million—more than double the volume of 2022.
This growth is largely fuelled by mixed fleet carriers integrating bikes alongside vans to meet sustainability goals and deal with increasing restrictions and complexity on vehicle access to city centres. As urban areas continue to tighten regulations and prioritize low-emission zones, cargo bikes will become an essential component of last-mile logistics. Additionally, growing customer demand for greener delivery methods further incentivizes carriers to embrace cycle logistics as a core part of their operations. Therefore, the results of the use-case highlighted in this report, and the formulated recommendations, should see a wide application in the future.
Technology improvements
This study highlights the transformative power of data in unlocking insights and enabling smarter decision-making. As cities transition towards cycle logistics, data-driven analyses play a crucial role in informing stakeholders and shaping impactful strategies. Access to comprehensive urban logistics data—encompassing both cycle logistics and traditional vehicles—is essential to understanding the evolving dynamics of urban deliveries.
The research also revealed a critical technology gap in the industry. Through meetings with Belgian cycle logistics operators, we observed consistently low levels of digitization and heavy reliance on manual processes. Many operators continue to plan routes and manage operations with minimal data-driven decision making, creating significant inefficiencies as they attempt to scale. AI and automation technologies present a major opportunity to transform these operations—from intelligent route optimization and real-time planning to automated dispatch and capacity forecasting. These tools will be essential for cycle logistics to scale efficiently while maintaining the cost and service level advantages over traditional delivery methods.
Operational model innovation will also play a crucial role in scaling cycle logistics. The strategic deployment of micro-hubs and nano-hubs throughout urban areas can significantly extend the effective range and efficiency of cargo bike operations. These distributed infrastructure networks enable shorter stem distances, more efficient load consolidation, and dynamic reloading during delivery rounds. When combined with AI-powered route optimization, such hub networks can dramatically increase the service area and delivery density achievable with cargo bikes.
Such insights form the foundation for strategic recommendations tailored to carriers and policymakers alike. Establishing a standardized framework for logistics data sharing would provide a robust, long-term solution, fostering the collection of actionable data and supporting future studies to guide sustainable urban logistics development. This framework should incorporate modern technology standards to enable the adoption of AI-powered tools that can help operators scale their operations effectively.
Market expansion possibilities
This study has focused on the B2C parcel deliveries and unlocked valuable insights. As cycle logistics also serves other logistics flows, such as B2B parcel deliveries and shuttle services, it would be relevant to conduct specific studies on these flows, as to understand the drivers to make efficient deliveries. The specific nature of these flows, as described in Sections 5.2 and 5.3, will highlight the conditions for cycle logistics to operate efficiently, including factors such as route optimization and urban context.
In addition to the above-mentioned flows, the potential of cycle logistics extends to the transport of services, such as maintenance and repair work, mobile workshops, intervention of technicians (plumber, electrician, window cleaner, gardener, etc...). Using such use cases and comparing interventions done with cargo bikes and vans would give very valuable information on the potential of cycle logistics in this segment of transport, providing efficiency figures and value for businesses.
These could be the focus of future studies.
8Appendices
8.1Summary of cargo-bike and van routes in KGS data set
This figure shows a breakdown of the average time spent on driving, service time and on the stem journeys between the hub and the first and last delivery (i.e. the first and last leg of a route) across all cargo-bike and van routes in the KGS data set.
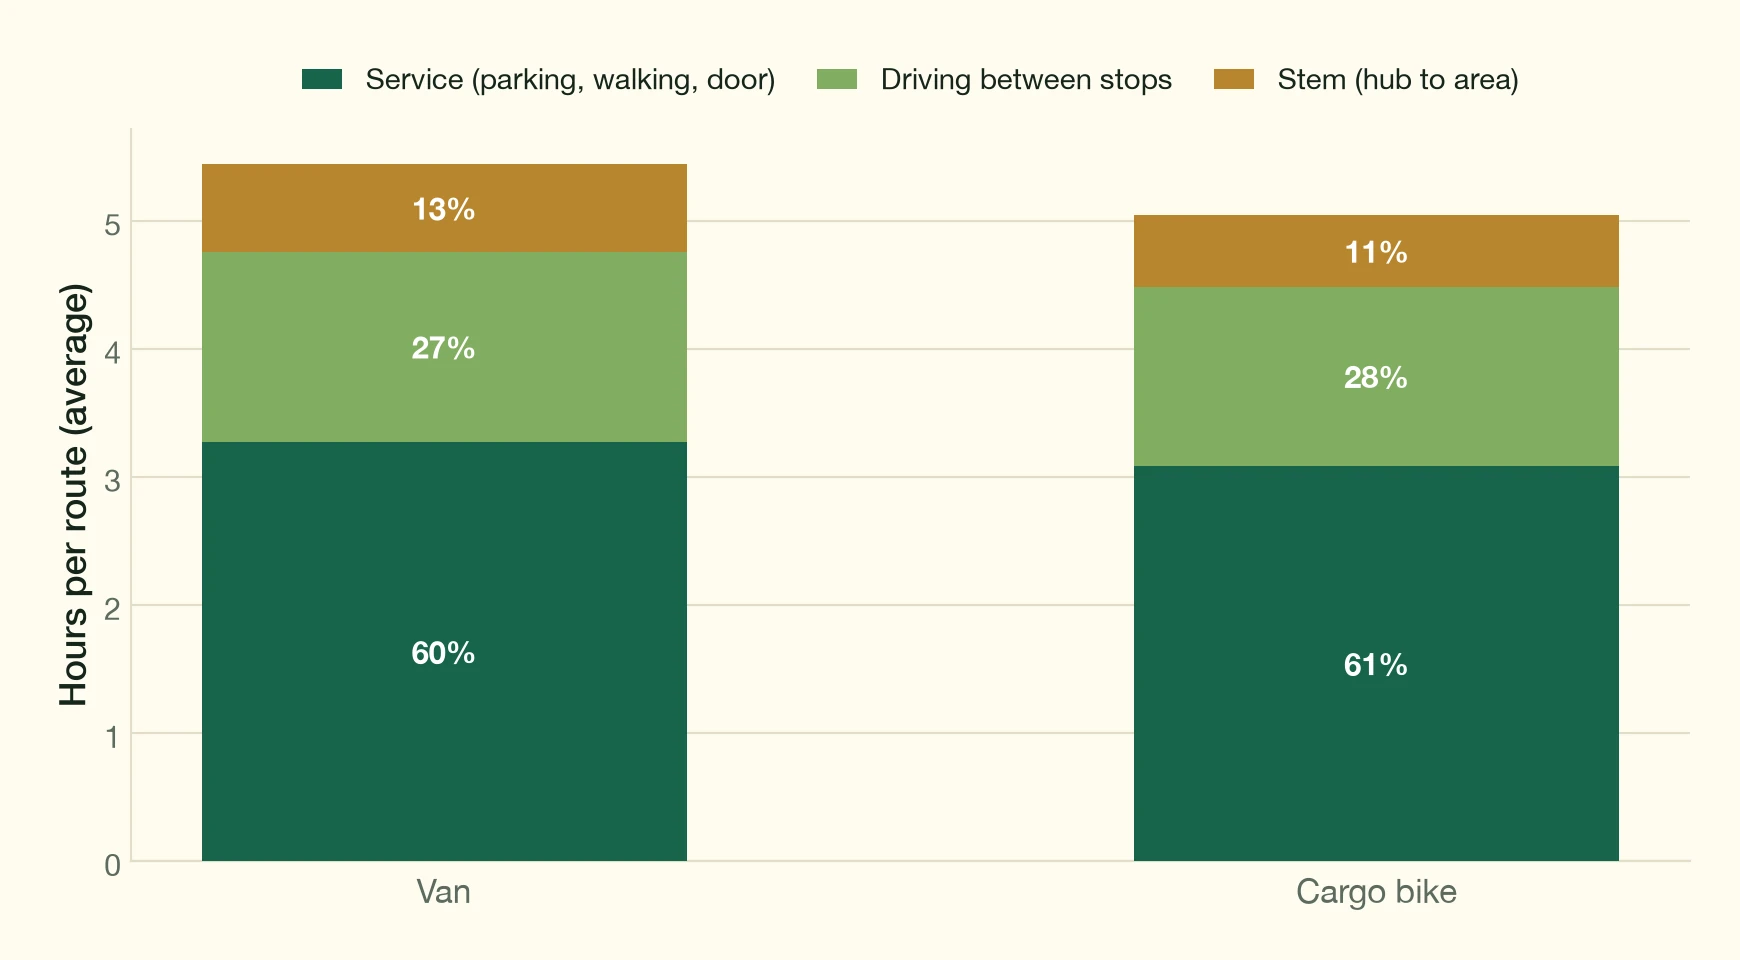
This breakdown confirms the importance of the service time in urban logistic, as for both vehicle types it represents around 60% of their time. It also shows that the stem distance has a considerable impact on the total amount of time spent driving. The make-up of van and cargo bike route is relatively similar in this dataset.
8.2Estimating Service Times
8.2.1Analysis with GPS traces
To create a rich dataset, we use a matching algorithm to pair the GPS traces with the task’s dataset.
In the figure below, we show in blue the GPS trace (with the speed of the vehicle at each time point). In orange, we show the detected stops where the GPS device is static. We match the GPS trace with the closest matching GPS stops to the sequence of stops in the Delivery Management System. In red, we show the corresponding time of a DMS delivery event.
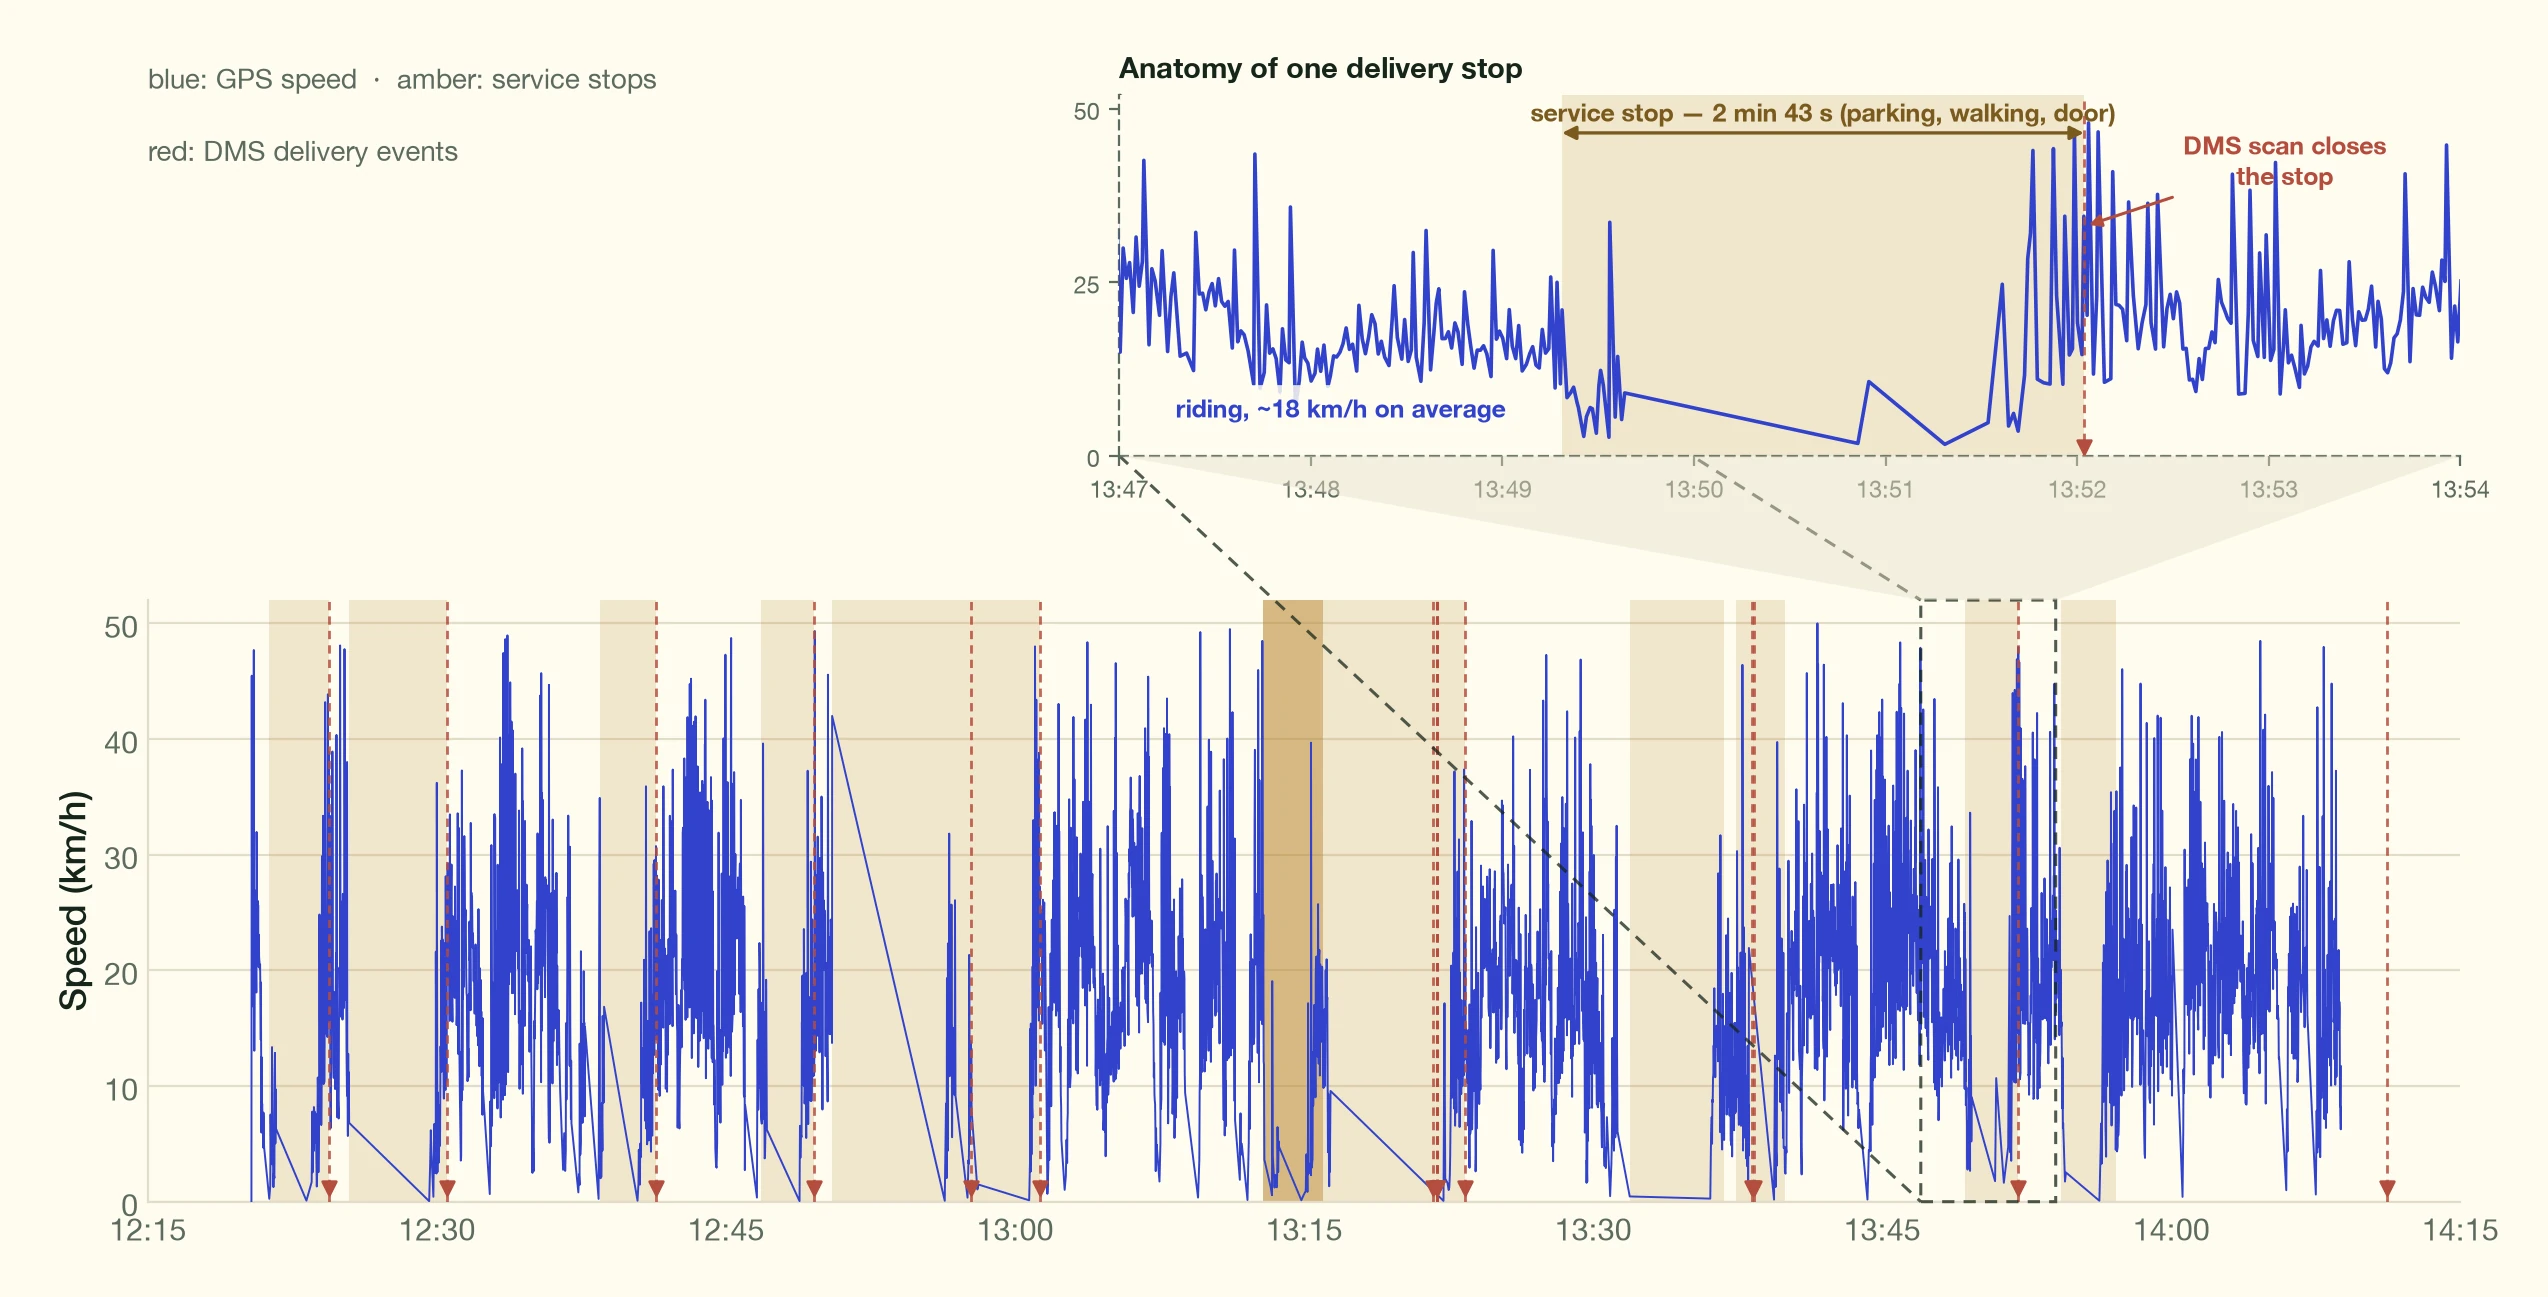
This allows us to study each journey segment between stops, i.e. the distance, duration and average speed, and the duration of the stop. When multiple deliveries are done at the same stop, we split the service time duration between each delivery.
8.2.2Analysis without GPS traces
For vehicles without a GPS tracker, our time estimation process involved several steps.
First, we were able to measure the total duration of each journey and its corresponding stop by using the DMS information and measuring the difference between the last stop and the current stop. Second, we obtained driving time estimates from Google Maps. We then calculated service time by subtracting the estimated driving time from the total time between deliveries. The service time includes activities such as finding parking, unloading parcels, walking to addresses, and delivering to doors.
8.3Distinction between Stops and Deliveries when analysing Service Times
In our analysis we focus mainly on looking at the service times of cargo bikes vs vans. One thing to bear in mind is that because of the high density of deliveries, there may be more than one delivery per stop.
Below we plot the distribution of deliveries per stop for the matched rounds (i.e. the cargo-bike rounds where a GPS tracker was installed on the vehicle).
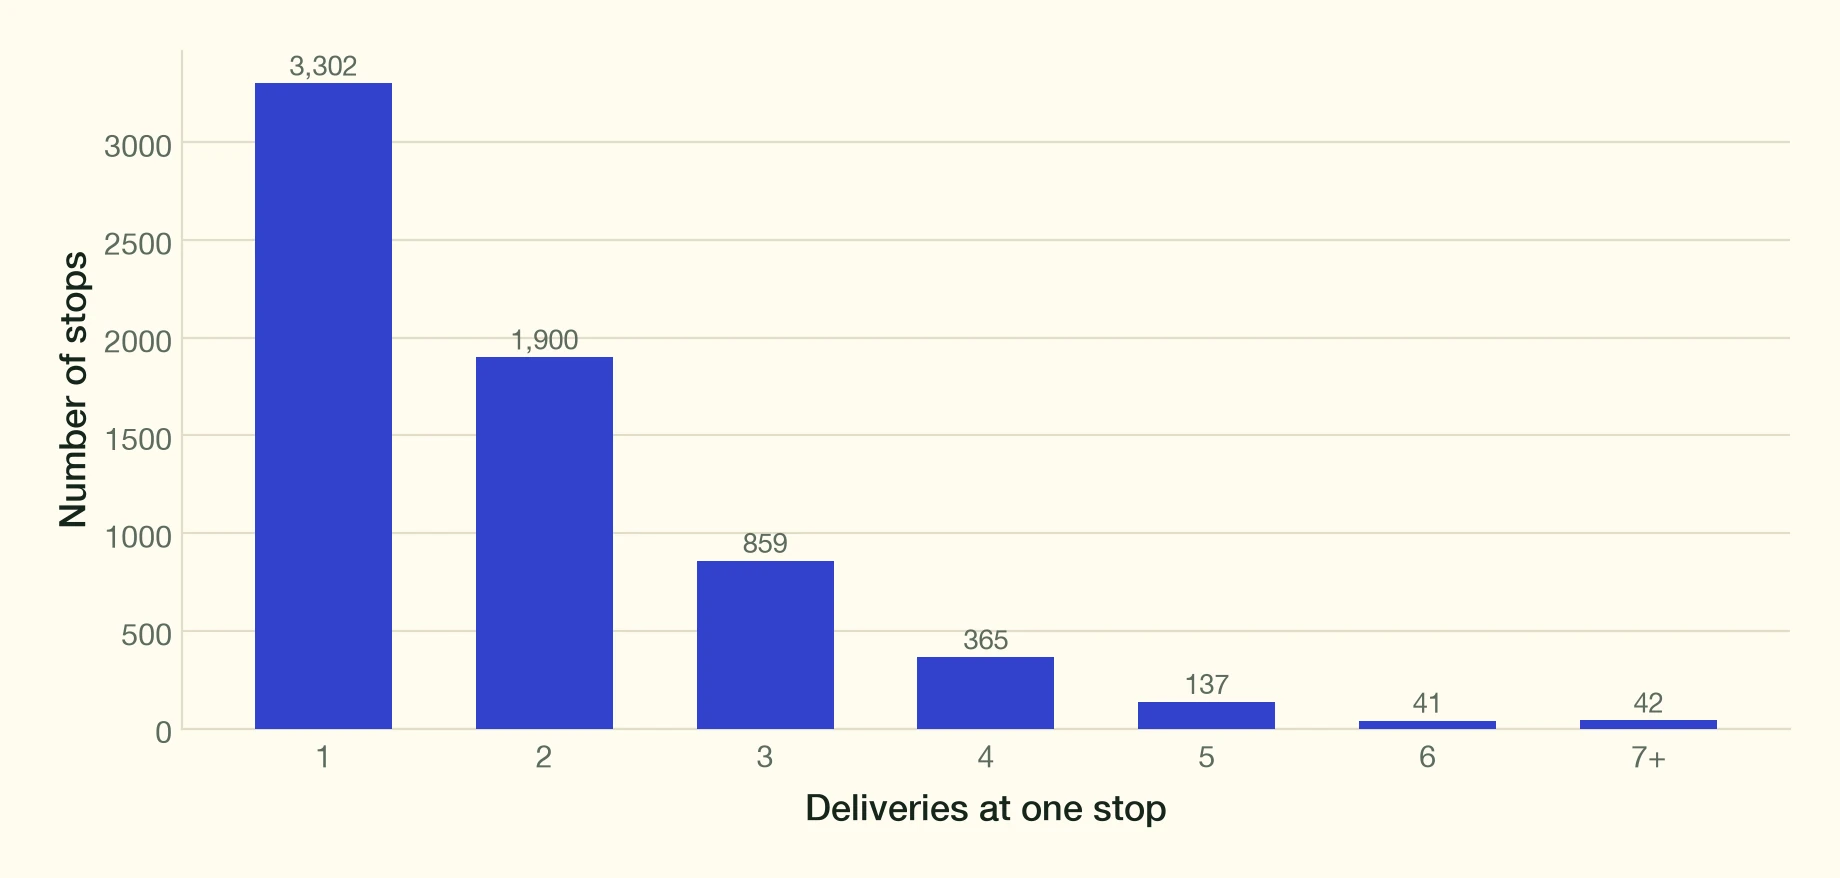
On average, there were 1.87 deliveries per stop (n=6646 matched GPS stops), with the median number of deliveries per stop being 2. In the dataset, the max number of deliveries per stop was 27.
In the figure below, we show the distribution of service time (i.e. the time where a vehicle is static) for stops that serve different numbers of deliveries (1,2,3 or 4). As expected, we find that stops that serve more deliveries take consistently longer (about one minute more per extra delivery).
The number of deliveries per stop has an important impact on overall efficiency. A single delivery stop will take on average 3min 20s per delivery, whereas a 4-delivery stop will take 1min30s per delivery. We also see that the zone of the delivery has an effect on the service time, for example, Dense Suburban area deliveries take about one minute less than Core Area deliveries.
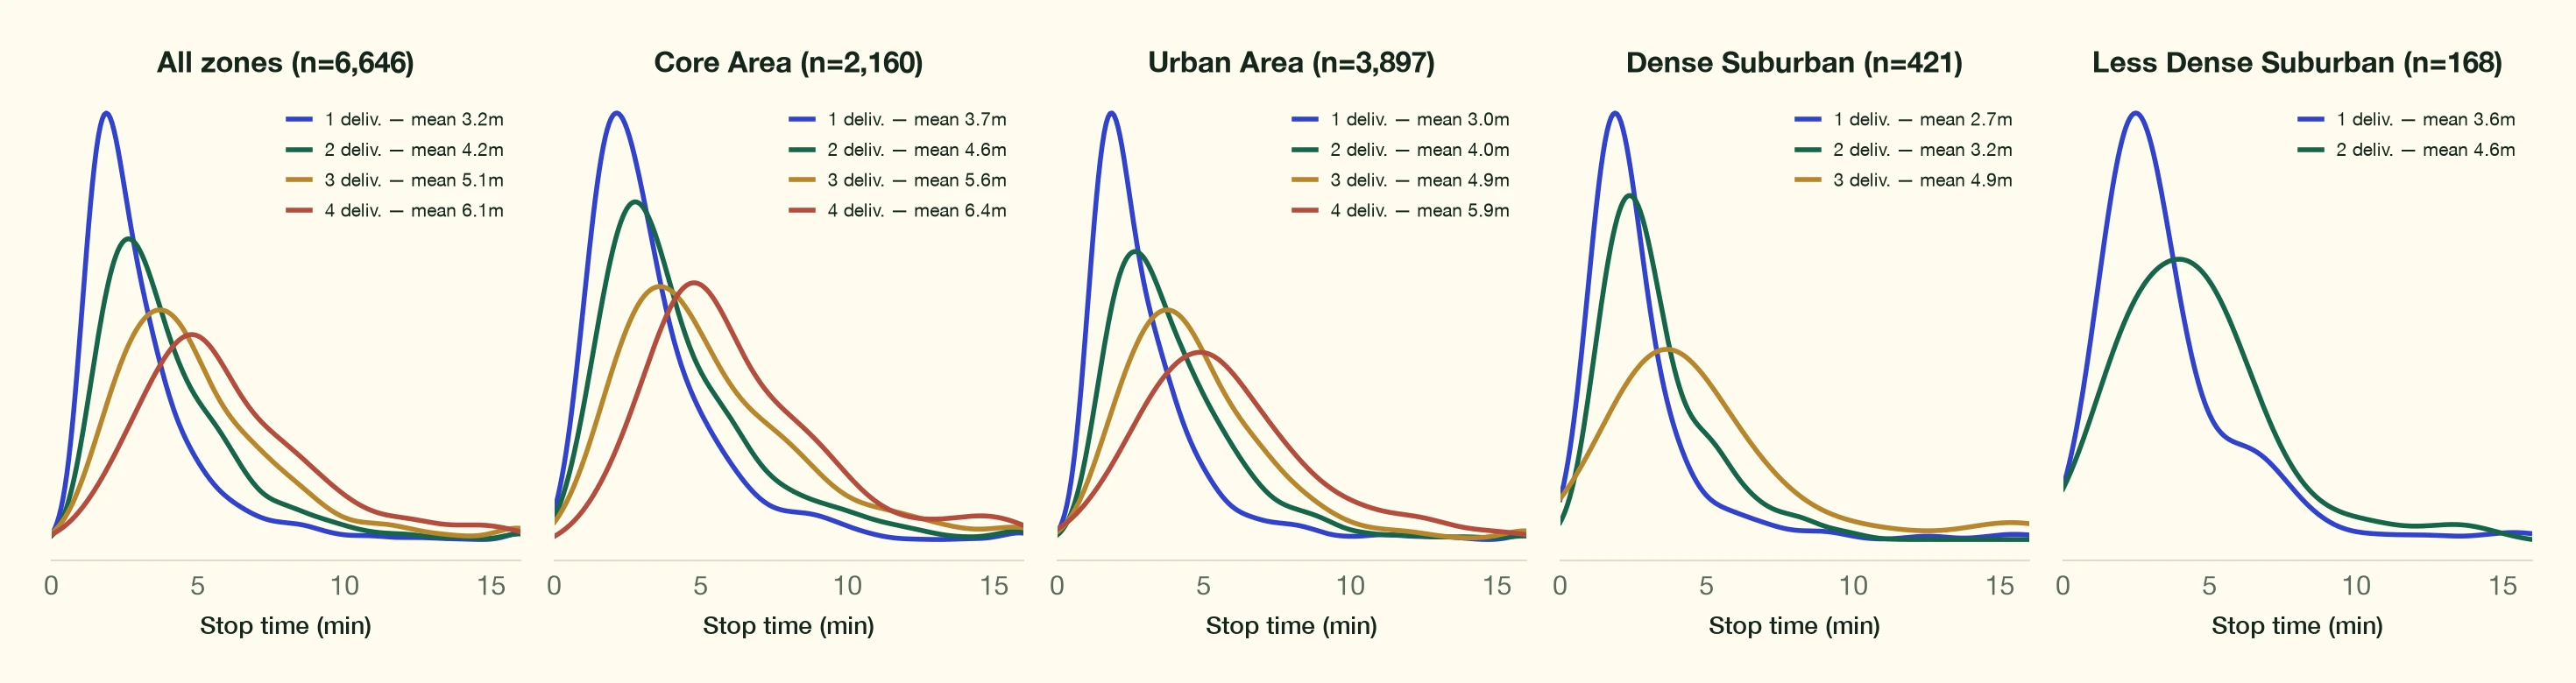
Core Area deliveries, for example, take consistently longer than Urban Area and Dense Suburban deliveries. This dataset only exists for the cargo-bikes where GPS trackers were installed. The density shows the relative number of stops (with 1, 2, 3, 4 deliveries) that have a specific duration. Distributions are estimated using KDE (kernel density estimation).
Ideally, it would be most informative to measure the service time associated with each stop, as it would allow us to better understand the associated time spent looking for parking, walking between the vehicle etc., however, since we only had access to GPS trackers on cargo-bikes, a fair comparison at the stop level with vans was not possible in our study. We limit our evaluations to time per delivery.
When multiple deliveries are serviced at the same stop, we divide the total time by the number of deliveries. For example, if 5 deliveries are handed at the reception of the same building, and the stop takes 5 minutes (of looking for parking, walking, and delivering the parcels), then we will report one minute per delivery, and may underplay the difficulty of dealing with an area. Because of this, it is better to see the service time we report as a lower bound on the time it would take for a vehicle to service a stop.
8.4Delivery Density across areas for cargo-bikes and vans
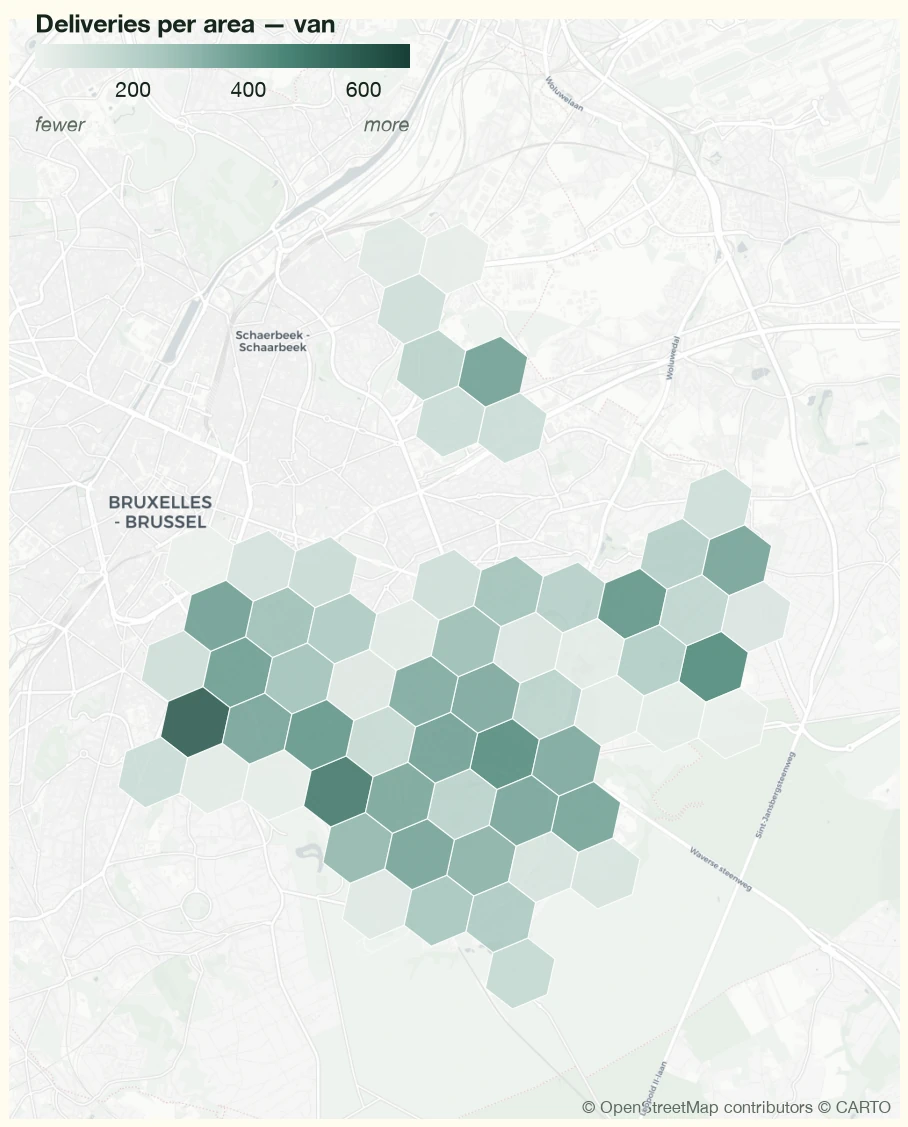
The heat maps illustrate the spatial distribution and density of deliveries for both cargo bikes and vans across different areas of Brussels. This visualisation reveals distinct patterns in how these two vehicle types are used within the urban landscape.
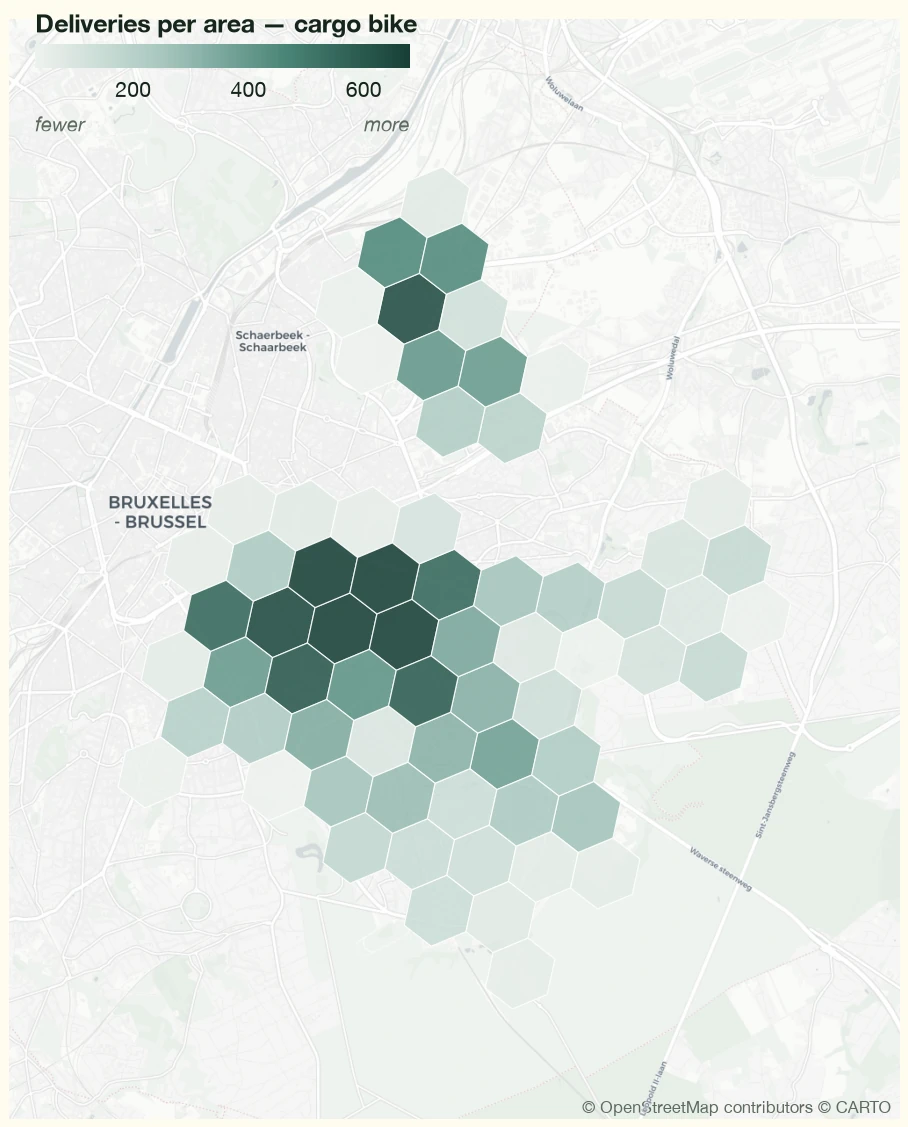
Cargo bikes demonstrate a more concentrated delivery pattern, with high-density clusters in central areas, particularly in Ixelles and Etterbeek. There's also a notable concentration of deliveries near the hub location, suggesting efficient use of cargo bikes for short-distance, high-density routes. The intensity of deliveries in these areas, as indicated by the darker red and orange hexagons, highlights the cargo bikes' effectiveness in navigating and serving densely populated urban centres.
In contrast, van deliveries show a more dispersed pattern. While there is some overlap with cargo bike zones, vans exhibit a broader reach, extending further east and south of the city centre. The generally lighter coloration of the van delivery hexagons indicates a lower density of deliveries per area compared to cargo bikes, consistent with their use in less congested, more spread-out regions.
The overlap in some areas suggests a degree of flexibility in vehicle choice for certain zones. However, the distinct patterns – cargo bikes dominating central, high-density areas and vans covering wider, more peripheral regions – underscore the complementary roles these vehicles play in the overall delivery strategy.
8.5Study Limitations and Future Research Directions
Several important limitations of our analysis should be acknowledged. Most significantly, our data collection was constrained by limited GPS tracker availability on vans, which restricted our ability to conduct certain analyses. We were unable to measure actual vehicle speeds in different urban contexts, quantify time spent searching for parking, or track walking time between vehicles and final delivery points.
These factors likely contribute significantly to the overall efficiency differential between vans and cargo bikes, and their absence from our analysis means we may be underestimating the true performance gap between vehicle types. Our service time analysis was also affected by the common occurrence of multiple deliveries per stop, which required us to average service times across deliveries. This averaging approach may underestimate the true complexity of certain delivery scenarios, particularly in dense urban areas where multiple deliveries to a single location are common. To address these limitations, further research with comprehensive GPS tracking across both vehicle types could provide more granular insights into the specific components of delivery efficiency, including parking, walking time, and actual travel speeds in various urban contexts.
These findings suggest that KGS Group's strategic shift toward cargo bikes in central zones is well-supported by operational data. However, the optimal delivery strategy appears to be a mixed fleet approach, with vehicle deployment carefully matched to urban context and route characteristics. Future research with more comprehensive tracking data could further refine our understanding of vehicle performance differences and help optimise deployment strategies.
Acknowledgements
We extend our sincere gratitude to the transport and logistics operators who participated in this study and shared their data, forming the foundation of our analysis. Their invaluable contribution has been pivotal, enabling the comprehensive analysis and unlocking key insights.
We also thank the Federal Public Service for Mobility and Transport, for the financial support, which made this study possible.
All map data in this report: © OpenStreetMap contributors.







References
- Robichet, A., Nierat, P., & Combes, F. (2022). First and last miles by cargo bikes: Ecological commitment or economically feasible? The case of a parcel service company in Paris. Transportation Research Record. ↩
- Verlinghieri, E., Itova, I., Collignon, N., & Aldred, R. (2021, 08). The promise of low-carbon freight: Benefits of cargo bikes in London. Possible. ↩
- Cairns, S., & Sloman, L. (2019). Potential for e-cargo bikes to reduce congestion and pollution from vans in cities. ↩
- Wrighton, S., & Reiter, K. (2016). CycleLogistics – Moving Europe Forward! Transportation Research Procedia, 12, pp. 950-958. ↩
- Holguin-Veras, J., Amaya, J., Encarnacion, T., Kyle, S., Wojtowicz, J., & Bts.gov. (2016, 06). Impacts of Freight Parking Policies in Urban Areas: The Case of New York City. City University of New York. University Transportation Research Center. ↩
- Dalla Chiara, G., & Goodchild, A. (2020, 10). Do commercial vehicles cruise for parking? Empirical evidence from Seattle. Transport Policy, 97, pp. 26-36. ↩
- Kale AI. (2023). Data-driven evaluation of cargo bike delivery performance in Brussels: Assessing operational advantages of cargo bikes over vans in the Brussels urban centre. ↩a ↩b ↩c
- Schrader, Maxwell, et al. "Urban context and delivery performance: Modelling service time for cargo bikes and vans across diverse urban environments." arXiv preprint arXiv:2409.06730 (2024). ↩a ↩b
- Chiara, G., Verma, R., Rula, K., & Goodchild, A. (2023). Biking the Goods How North American Cities Can Prepare for and Promote Large-Scale Adoption of Cargo e-Bikes. ↩
- Meta & CIESIN, Columbia University. (2022). High Resolution Population Density Maps & Demographic Estimates. Data for Good at Meta. ↩
- Belgian Cycle Logistics Federation. (2024). Barometer 2024 of Cycle Logistics in Belgium. ↩
Citation
Please cite this work as:
Collignon, N., Sarrazin, R., & Van de Casteele, P. (2025). Transforming Urban Deliveries: Data Evidence from Belgium’s Cargo Bike Transition. Report commissioned by the Belgian Cycle Logistics Federation. https://doi.org/10.5281/zenodo.21535887
BibTeX citation:
@techreport{collignon2025transforming,
  title       = {Transforming Urban Deliveries: Data Evidence
                 from Belgium's Cargo Bike Transition},
  author      = {Collignon, Nicolas and Sarrazin, Renaud
                 and {Van de Casteele}, Philippe},
  institution = {Belgian Cycle Logistics Federation},
  year        = {2025},
  type        = {Report},
  doi         = {10.5281/zenodo.21535887},
  url         = {https://kale.ai/reports/transforming-urban-deliveries/}
}
Author Contributions
Nicolas Collignon (Kale AI) designed and performed the data analysis — GPS processing, stop detection and matching, urban zone classification, and efficiency modelling — and wrote the data-analysis sections of the report. Renaud Sarrazin (Urbike) wrote the Broader Applications section, contributed the lifecycle emissions assessment and operational expertise on cargo bike logistics, and, with Philippe Van de Casteele, defined the study's narrative and scope. Philippe Van de Casteele (Belgian Cycle Logistics Federation) commissioned and steered the study, shaped its narrative and scope, and contributed sector context on Belgian cycle logistics.